Evaluating persistent, replicated message queues

Introduction
Message queues are central to many distributed systems and often provide a backbone for asynchronous processing and communication between (micro)services. They are useful in a number of situations. Any time we want to execute a task asynchronously, we put the task on a queue; some executor (could be another thread, process, or machine) eventually runs it. Or, one component might produce a stream of events that are stored by the message queue. Other, decoupled components, consume the events asynchronously, either on-line or after some period of time.
Various message queue implementations can give various guarantees on message persistence and delivery. For some use-cases, it is enough to have an in-memory, volatile message queue. For others, we want to be sure that once the message send completes, the message is persistently enqueued and will be eventually delivered, despite node or system crashes.
The mqperf tests inspect systems on the 'safe' side of this spectrum, which try to make sure that messages are not lost by:
- persisting messages to disk
- replicating messages across the network
We will examine the characteristics of a number of message queueing and data streaming systems, comparing their features, replication schemes, supported protocols, operational complexity and performance. All of these factors might impact which system is best suited for a given task. In some cases, you might need top-performance, which might come with tradeoffs in terms of other features. In others, performance isn’t the main factor, but instead compatibility with existing protocols, message routing capabilities or deployment overhead play the central role.
When talking about performance, we’ll take into account both how many messages per second a given queueing system can process, but also at the processing latency, which is an important factor in systems which should react to new data in near real-time (as is often the case with various event streams). Another important aspect is message send latency, that is how long it takes for a client to be sure a message is persisted in the queueing system. This may directly impact e.g. the latency of http endpoints and end-user experience.
Version history
| 26 Jul 2021 | Refresh of the 2020 edition. Tests of RedPanda and Redis Streams. Added encryption and compression info to the summary. Co-authored with Bartłomiej Turos and Robert Dziewoński. |
| 8 Dec 2020 | 2020 edition: extended feature comparison, updated benchmarks, new queues (Pulsar, PostgreSQL, Nats Streaming); dropping ActiveMQ 5 in favor of ActiveMQ Artemis. Co-authored with Kasper Kondzielski. |
| 1 August 2017 | Updated the results for Artemis, using memory-mapped journal type and improved JMS test client |
| 18 July 2017 | 2017 edition: updating with new versions; adding latency measurements; adding Artemis and EventStore. Co-authored with Maciej Opała |
| 4 May 2015 | 2015 edition: updated with new versions, added ActiveMQ; new site |
| 1 July 2014 | original at Adam Warski's blog |
Tested queues
There is a number of open-source messaging projects available, but only some support both persistence and replication. We'll evaluate the performance and characteristics of 12 message queues, in no particular order:
- Amazon SQS
- MongoDB
- PostgreSQL
- RabbitMq
- Kafka
- Pulsar
- ActiveMQ Artemis
- RocketMQ
- NATS Streaming
- EventStore
- RedPanda
- Redis Streams
You might rightfully notice that not all of these are message queueing systems. Both MongoDB and PostgreSQL (and to some degree, EventStore) are general-purpose databases. However, using some of their mechanisms it’s possible to implement a message queue on top of them. If such a simple queue meets the requirements and the database system is already deployed for other purposes, it might be reasonable to reuse it and reduce operational costs.
Except for SQS, all of the systems are open-source, and can be self-hosted on your own servers or using any of the cloud providers, both directly or through Kubernetes. Some systems are also available as hosted, as-a-service offerings.
Queue characteristics
We’ll be testing and examining the performance of a single, specific queue usage scenario in detail, as well as discussing other possible queue-specific use-cases more generally.
In our scenario, as mentioned in the introduction, we’ll put a focus on safety. The scenario tries to reflect a reasonable default that you might start with when developing applications leveraging a message queue, however by definition we’ll cover only a fraction of possible use-cases.
There are three basic operations on a queue which we'll be using:
- sending a message to the queue
- receiving a message from the queue
- acknowledging that a message has been processed
On the sender side, we want to have a guarantee that if a message send call completes successfully, the message will be eventually processed. Of course, we will never get a 100% "guarantee", so we have to accept some scenarios in which messages will be lost, such as a catastrophic failure destroying all of our geographically distributed servers. Still, we want to minimise message loss. That's why:
- messages should survive a restart of the server, that is messages should be persisted to a durable store (hard disk). However, we accept losing messages due to unflushed disk buffers (we do not require
fsyncs to be done for each message). - messages should survive a permanent failure of a server, that is messages should be replicated to other servers. We'll be mostly interested in synchronous replication, that is when the send call can only complete after the data is replicated. Note that this additionally protects from message loss due to hard disk buffers not being flushed. Some systems also offer asynchronous replication, where messages are accepted before being replicated, and thus there's more potential for message loss. We'll make it clear later which systems offer what kind of replication.
On the receiver side, we want to be able to receive a message and then acknowledge that the message was processed successfully. Note that receiving alone should not remove the message from the queue, as the receiver may crash at any time (including right after receiving, before processing). But that could also lead to messages being processed twice (e.g. if the receiver crashes after processing, before acknowledging); hence our queue should support at-least-once delivery.
With at-least-once delivery, message processing should be idempotent, that is processing a message twice shouldn't cause any problems. Once we assume that characteristic, a lot of things are simplified; message acknowledgments can be done asynchronously, as no harm is done if an ack is lost and the message re-delivered. We also don't have to worry about distributed transactions. In fact, no system can provide exactly-once delivery when integrating with external systems (and if it claims otherwise: read the fine print); it's always a choice between at-most-once and at-least-once.
By requiring idempotent processing, the life of the message broker is easier, however, the cost is shifted to writing application code appropriately.
Performance testing methodology
We'll be performing three measurements during the tests:
- throughput in messages/second: how fast on average the queue is, that is how many messages per second can be sent, and how many messages per second can be received & acknowledged
- 95th percentile of processing latency (over a 1-minute window): how much time (in milliseconds) passes between a message send and a message receive. That is, how fast the broker passes the message from the sender to the receiver
- 95th percentile of send latency (over a 1-minute window): how long it takes for a message send to complete. That's when we are sure that the message is safely persisted in the cluster, and can e.g. respond to our client's http request "message received".
When setting up the queues, our goal is to have 3 identical, replicated nodes running the message queue server, with automatic fail-over. That’s not always possible with every queue implementation, hence we’ll make it explicit what’s the replication setup in each case.
The sources for the tests as well as the Ansible scripts used to setup the queues are available on GitHub.
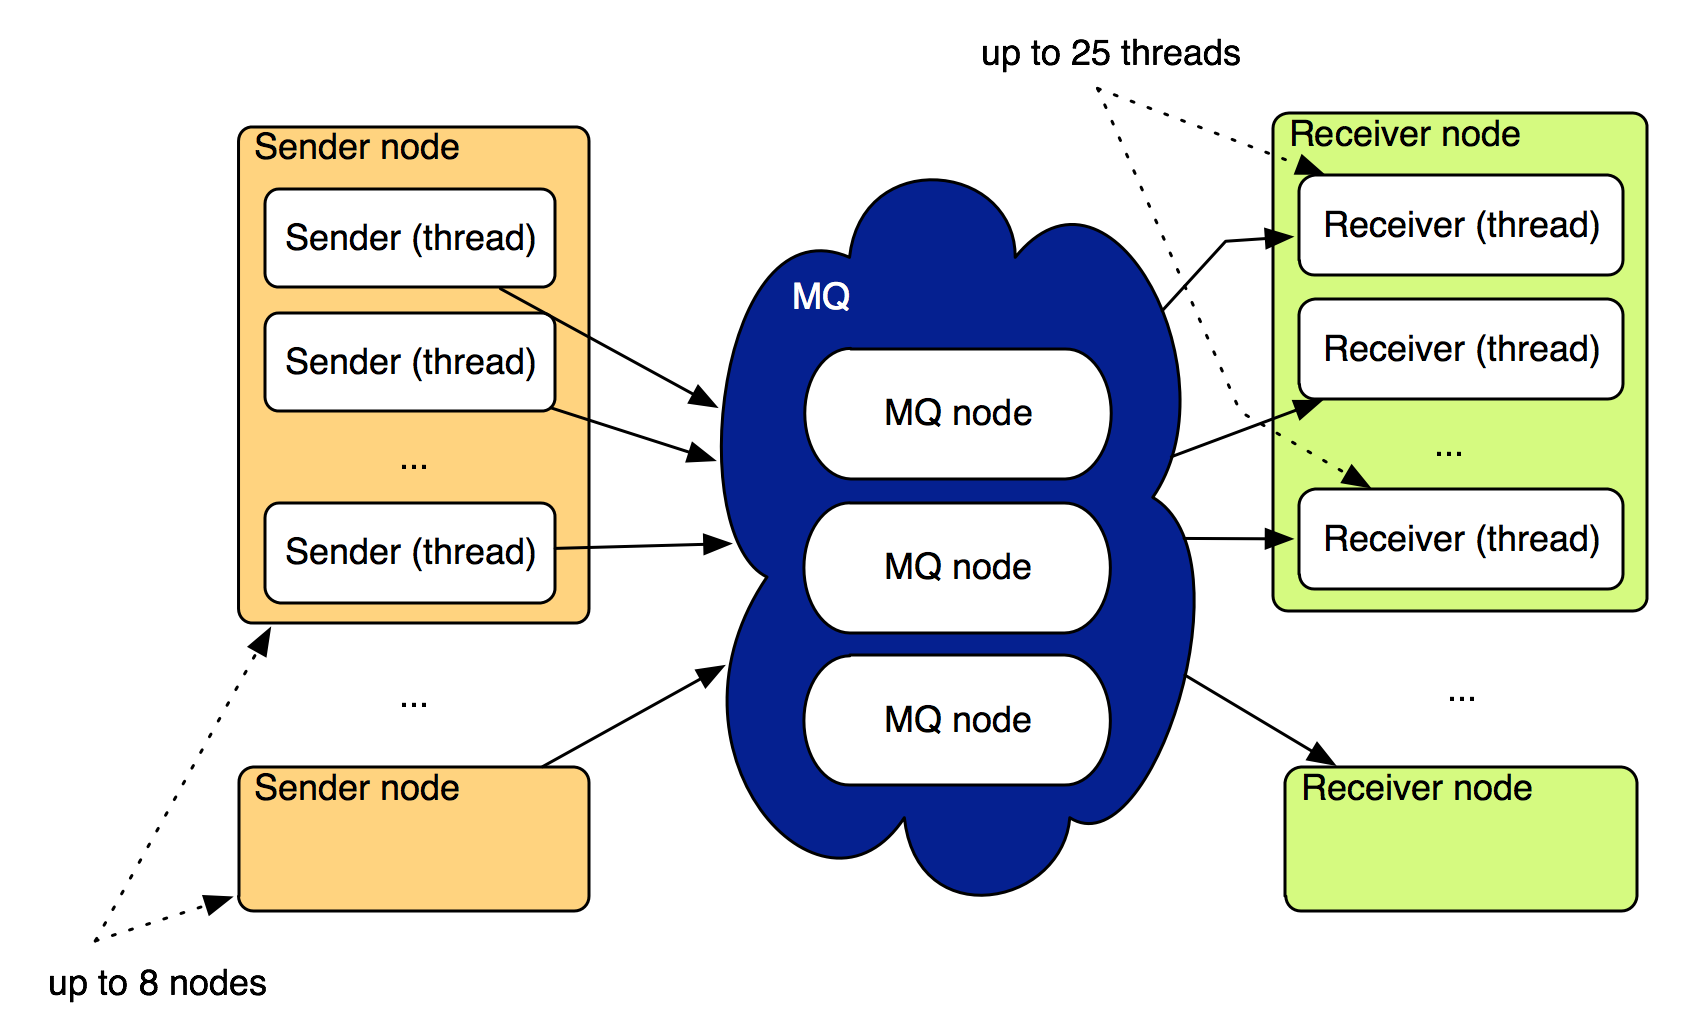
Each test run is parametrised by the type of the message queue tested, optional message queue parameters, number of client nodes, number of threads on each client node and message count. A client node is either sending or receiving messages; in the tests we used from 1 to 20 client nodes of each type, each running from 1 to 100 threads. By default there are twice as many receiver nodes as sender nodes, but that’s not a strict rule and we’re modifying these proportions basing on what’s working best for a given queue implementation.
Each Sender thread tries to send the given number of messages as fast as possible, in batches of random size between 1 and 10 messages. The messages are picked from a pool of messages, randomly generated on startup.
The Receiver tries to receive messages (also in batches of up to 10 messages), and after receiving them, acknowledges their delivery (which should cause the message to be removed from the queue). The test ends when no messages are received for a minute.
The queues have to implement the Mq interface. The methods should have the following characteristics:
sendshould be synchronous, that is when it completes, we want to be sure (what "sure" means exactly may vary) that the messages are sentreceiveshould receive messages from the queue and block them from being received by other clients; if the node crashes, the messages should be returned to the queue and re-delivered, either immediately or after a time-outackshould acknowledge delivery and processing of the messages. Acknowledgments can be asynchronous, that is we don't have to be sure that the messages really got deleted
Server setup
Both the clients, and the messaging servers used r5.2xlarge memory-optimized EC2 instances; each such instance has 8 virtual CPUs, 64GiB of RAM and SSD storage (in some cases additional gp2 disks where used).
All instances were started in a single availability zone (eu-west-1). While for production deployments it is certainly better to have the replicas distributed across different locations (in EC2 terminology - different availability zones), but as the aim of the test was to measure performance, a single availability zone was used to minimise the effects of network latency as much as possible.
The servers were provisioned automatically using Ansible. All of the playbooks are available in the github repository, hence the tests should be reproducible.
Test results were aggregated using Prometheus and visualized using Grafana. We'll see some dashboard snapshots with specific results later.
While the above might not guarantee the best possible performance for each queue (we might have used r5.24xlarge for example), the goal was to get some common ground for comparison between the various systems. Hence, the results should be treated only comparatively, and the tests should always be repeated in the target environment before making any decisions.
MongoDB
| Version | server 4.2, java driver 3.12.5 |
| Replication | configurable, asynchronous & synchronous |
| Replication type | active-passive |
Mongo has two main features which make it possible to easily implement a durable, replicated message queue on top of it: very simple replication setup (we'll be using a 3-node replica set), and various document-level atomic operations, like find-and-modify. The implementation is just a handful of lines of code; take a look at MongoMq.
Replication in Mongo follows a leader-follower setup, that is there’s a single node handling writes, which get replicated to follower nodes. As an optimization, reads can be offloaded to followers, but we won’t be using this feature here. Horizontal scaling is possible by sharding and using multiple replica sets, but as far as message queueing is concerned this would make the queue implementation significantly more complex. Hence this queue implementation is bound by the capacity of the leader node.
Network partitions (split-brain scenarios), which are one of the most dangerous fault types in replicated databases, are handled by making sure that only the partition with the majority of nodes is operational.
We are able to control the guarantees which send gives us by using an appropriate write concern when writing new messages:
WriteConcern.W1ensures that once a send completes, the messages have been written to disk (but the buffers may not be yet flushed, so it's not a 100% guarantee) on a single node; this corresponds to asynchronous replicationWriteConcern.W2ensures that a message is written to at least 2 nodes (as we have 3 nodes in total, that's a majority) in the cluster; this corresponds to synchronous replication
The main downside of the Mongo-based queue is that:
- messages can't be received in bulk – the
find-and-modifyoperation only works on a single document at a time - when there's a lot of connections trying to receive messages, the collection will encounter a lot of contention, and all operations are serialised.
And this shows in the results: sends are much faster than receives. But the performance isn’t bad despite this.
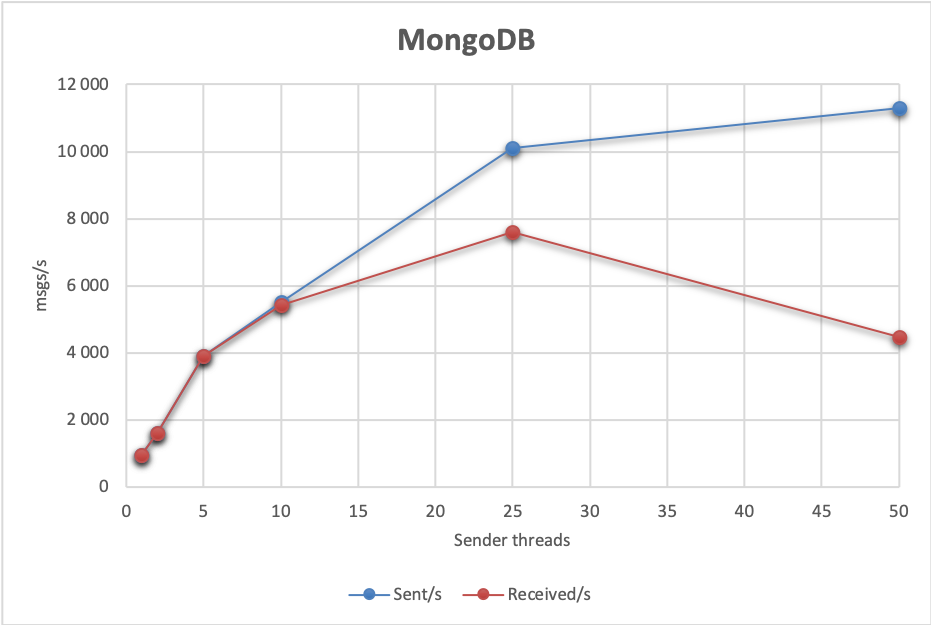
A single-thread, single-node, synchronous replication setup achieves 958 msgs/s sent and received. The maximum send throughput with multiple thread/nodes that we were able to achieve is about 11 286 msgs/s (25 threads, 2 nodes), while the maximum receive rate is 7 612 msgs/s (25 threads, 2 nodes). An interesting thing to note is that the receive throughput quickly achieves its maximum value, and adding more threads (clients) only decreases performance. The more concurrency, the lower overall throughput.
With asynchronous replication, the results are of course better: up to 38 120 msg/s sent and 8 130 msgs/s received. As you can see, here the difference between send and receive performance is even bigger.
What about latencies? In both synchronous and asynchronous tests, the send latency is about 48 ms, and this doesn't deteriorate when adding more concurrent clients.
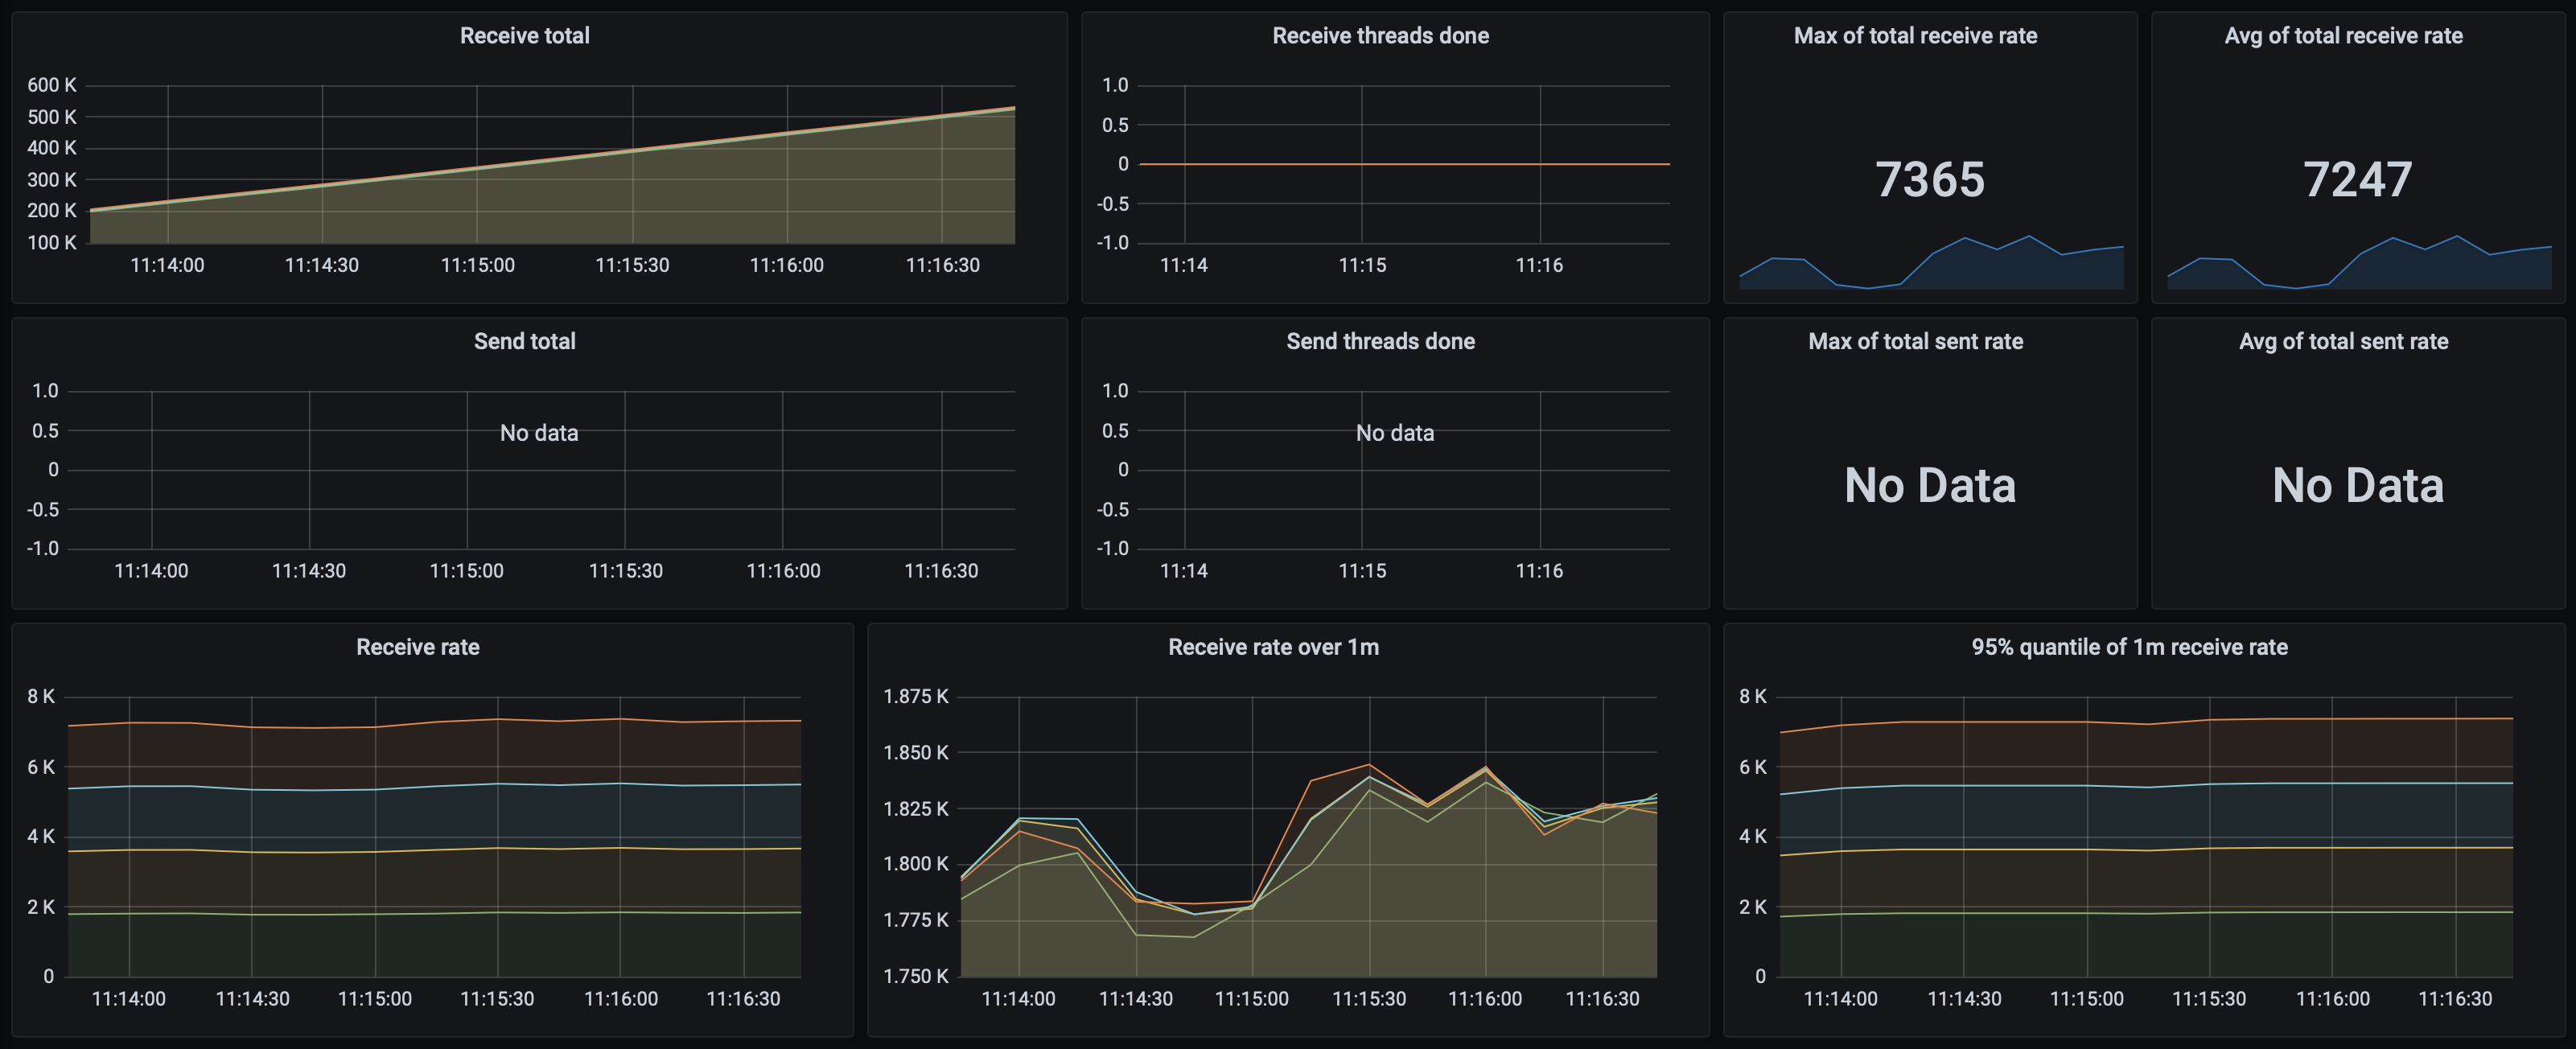
As for the processing latency, measurements only make sense when the receive rate is the same as the sending rate. When the clients aren't able to receive messages as fast as they are sent, the processing time goes arbitrarily up.
With 2 nodes running 5 threads each, Mongo achieved a throughput of 3 913 msgs/s with a processing latency of 48 ms. Anything above that caused receives to fall back behind sends. Here's the dashboard for that test:
Performance results in detail when using synchronous replication are as follows:
| Threads | Sender nodes | Receiver nodes | Send msgs/s | Receive msgs/s | Processing latency | Send latency |
|---|---|---|---|---|---|---|
| 1 | 1 | 2 | 958,00 | 958,00 | 48,00 | 48,00 |
| 5 | 1 | 2 | 3 913,00 | 3 913,00 | 48,00 | 48,00 |
| 25 | 1 | 2 | 10 090,00 | 7 612,00 | 60000,00 | 48,00 |
| 1 | 2 | 4 | 1 607,00 | 1 607,00 | 48,00 | 48,00 |
| 5 | 2 | 4 | 5 532,00 | 5 440,00 | 60000,00 | 48,00 |
| 25 | 2 | 4 | 11 286,00 | 4 489,00 | 60000,00 | 53,00 |
Overall, if you are already using Mongo in your application, you have small traffic and don’t need to use any of the more advanced messaging protocols or features, a queue implementation on top of Mongo might work just fine.
PostgreSQL
| Version | server 12.4, java driver 42.2.12 |
| Replication | configurable, asynchronous & synchronous |
| Replication type | active-passive |
When implementing a queue on top of PostgreSQL, we are using a single jobs table:
CREATE TABLE IF NOT EXISTS jobs(
  id UUID PRIMARY KEY,
  content TEXT NOT NULL,
  next_delivery TIMESTAMPTZ NOT NULL)
Sending a message amounts to inserting data to the table. Receiving a message bumps the next delivery timestamp, making the message invisible for other receivers for some period of time (during which we assume that the message should be processed, or is otherwise redelivered). This is similar to how SQS works, which is discussed next. Acknowledging a message amounts to deleting the message from the database.
When receiving messages, we issue two queries (in a single transaction!). The first looks up the messages to receive, and puts a write lock on them. The second updates the next delivery timestamp:
SELECT id, content FROM jobs WHERE next_delivery <= $now FOR UPDATE SKIP LOCKED LIMIT n
UPDATE jobs SET next_delivery = $nextDelivery WHERE id IN (...)
Thanks to transactionality, we make sure that a single message is received by a single receiver at any time. Using write locks, FOR UPDATE and SKIP LOCKED help improve the performance by allowing multiple clients to receive messages concurrently, trying to minimise contention.
As with other messaging systems, we replicate data. PostgreSQL uses leader-follower replication, by setting the following configuration options, as described in a blog post by Kasper:
synchronous_standby_namesis set toANY 1 (slave1, slave2)synchronous_commitis set toremote_write
It’s also possible to configure asynchronous replication, as well as require an fsync after each write. However, an important limitation of PostgreSQL is that by default, there’s no automatic failover. In case the leader fails, one of the followers must be promoted by hand (which, in a way, solves the split brain problem). There are however both open-source and commercial solutions, which provide modules for automatic failover.
In terms of performance, a baseline single-thread setup achieves around 3 800 msgs/s sent and received. Such a queue can handle at most 23 000 msgs/s sent and received using 5 threads on 2 sending and 4 receiving nodes:
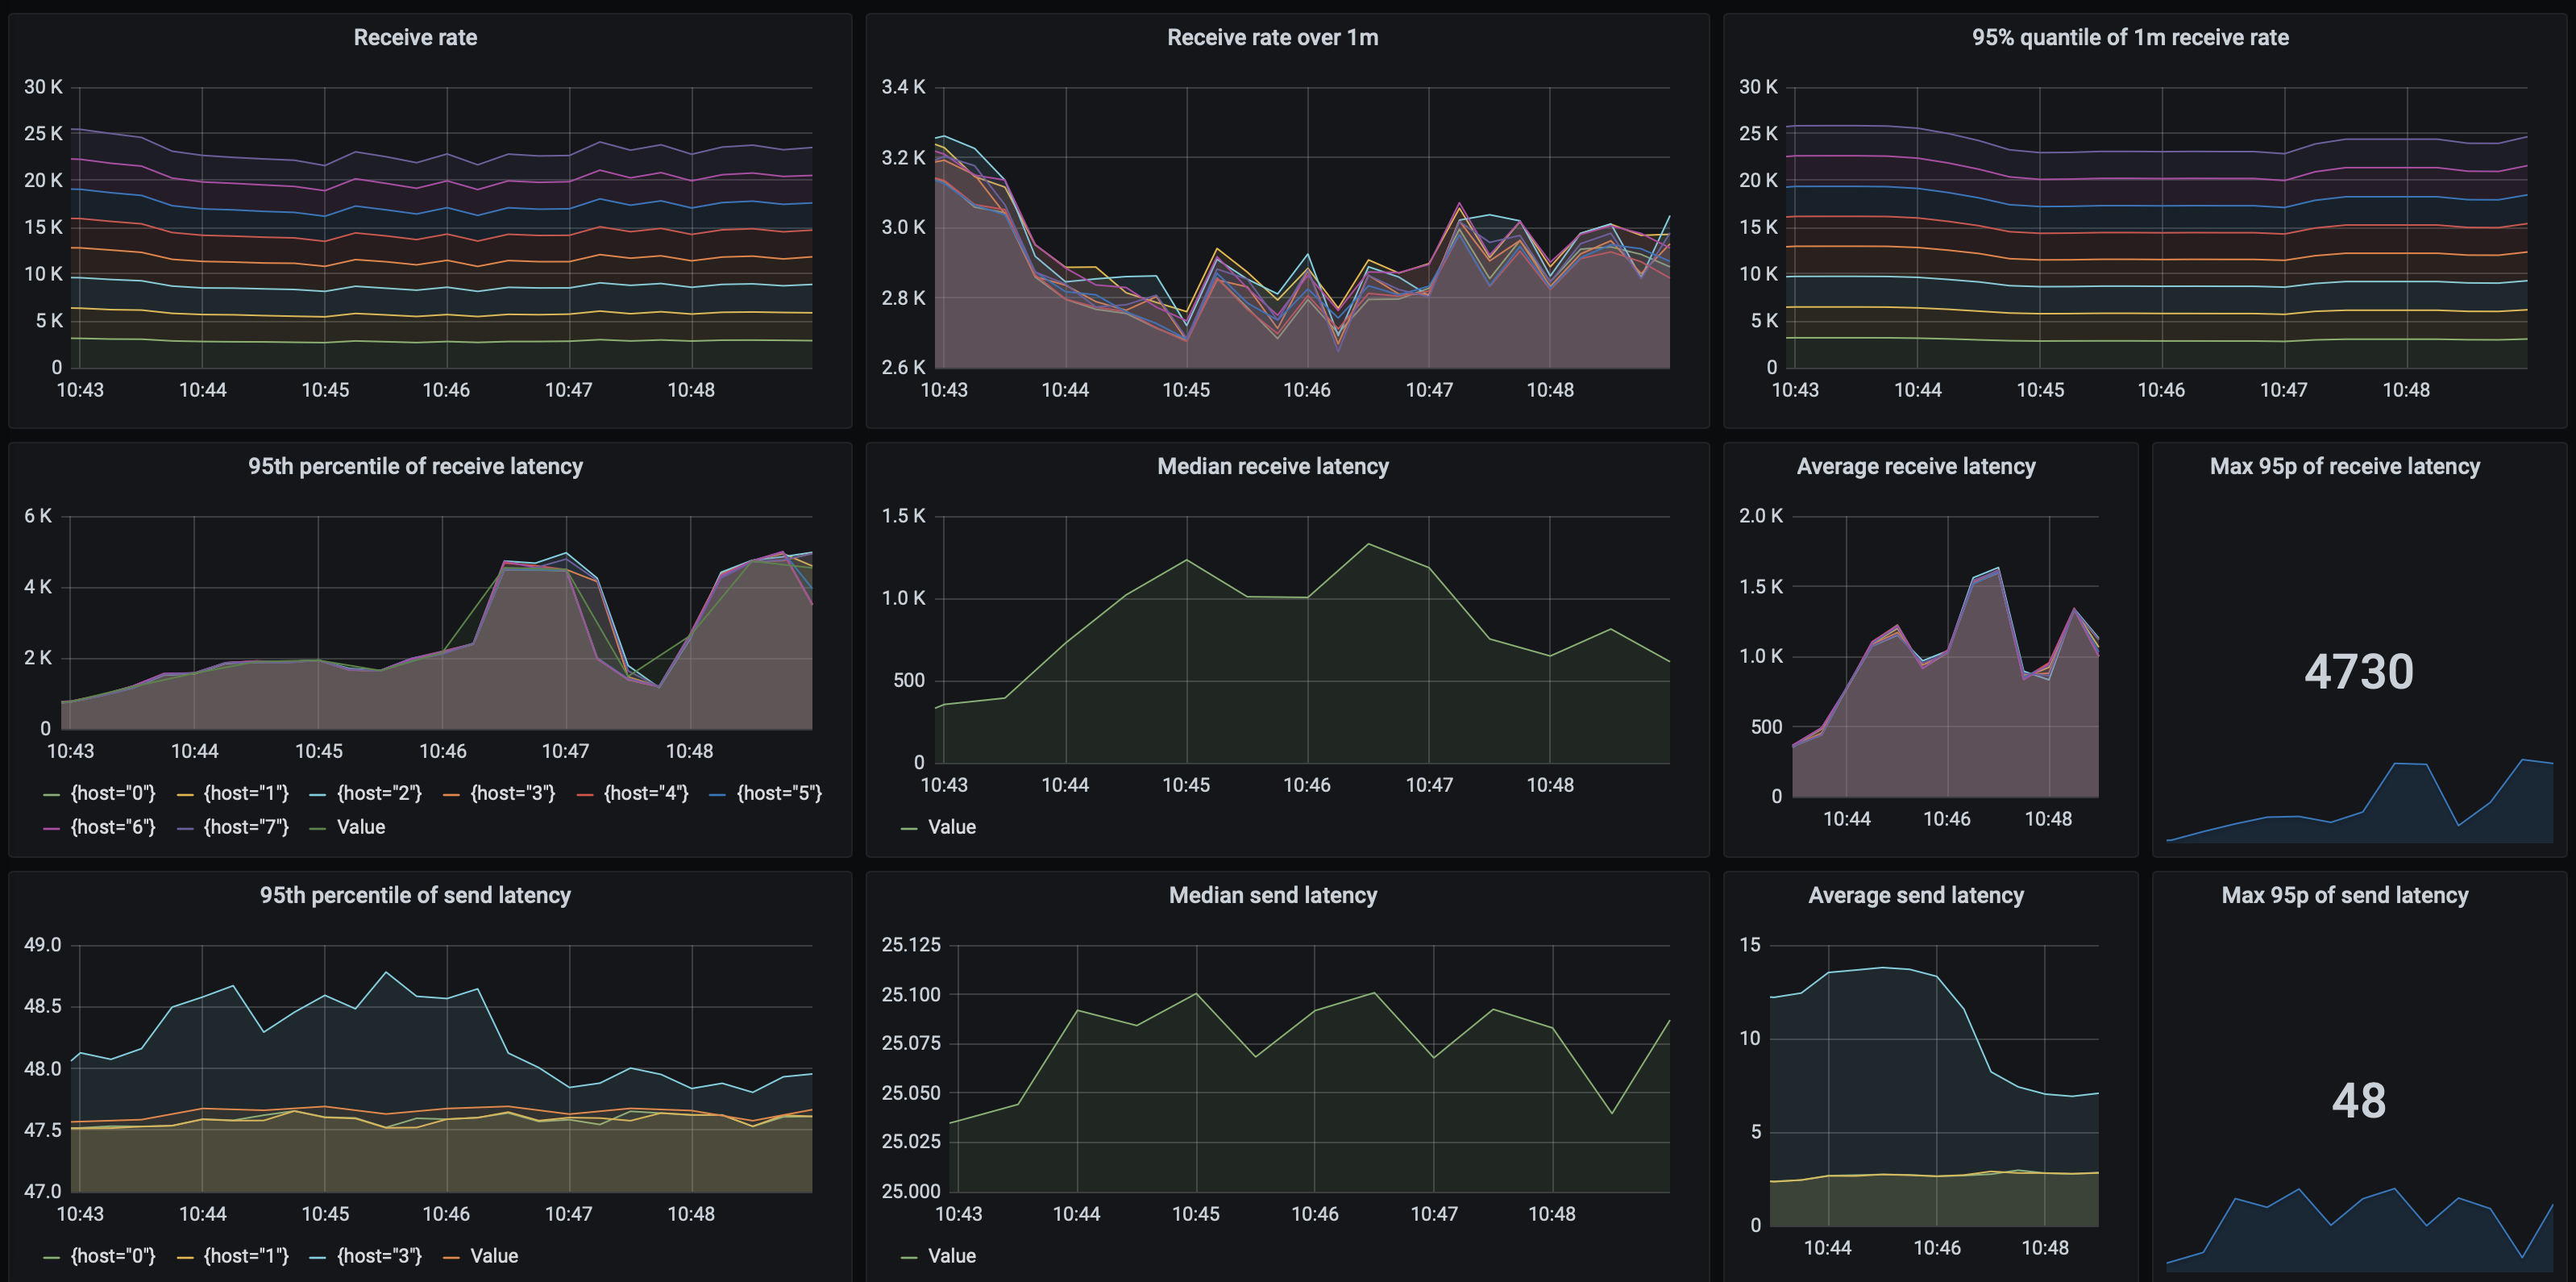
Increasing concurrency above that causes receive performance to degrade:
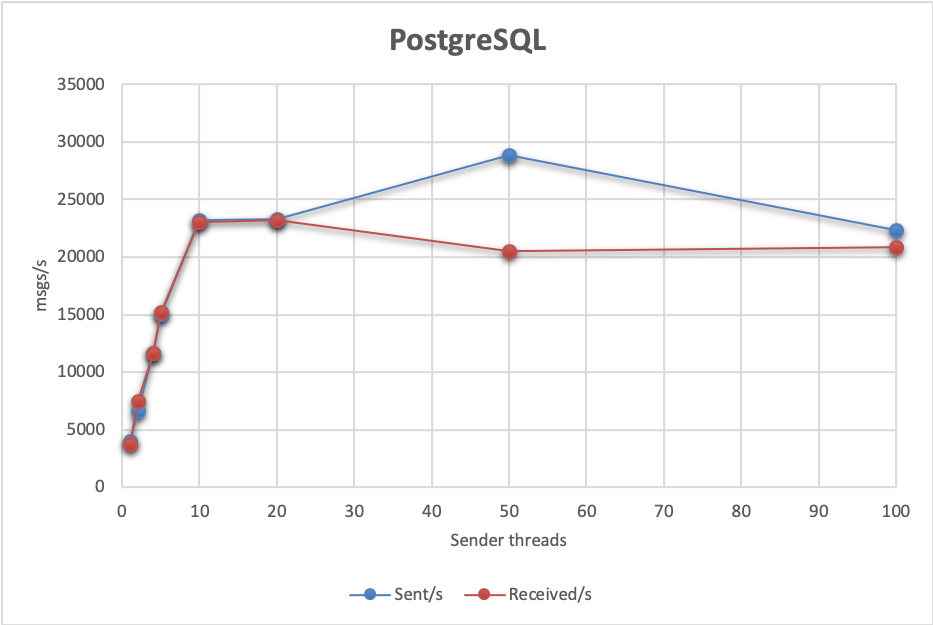
Send latency is usually at 48ms. However, total processing latency is quite poor. As with Mongo, taking into account only the tests where the send throughput was on par with receive throughput, processing latency varied from 1172 ms to 17 975 ms. Here are the results in full:
| Threads | Sender nodes | Receiver nodes | Send msgs/s | Receive msgs/s | Processing latency | Send latency |
|---|---|---|---|---|---|---|
| 1 | 1 | 2 | 4 034,00 | 3 741,00 | 60000,00 | 47,00 |
| 5 | 1 | 2 | 15 073,00 | 15 263,00 | 5738,00 | 48,00 |
| 25 | 1 | 2 | 2 267,00 | 2 317,00 | 17957,00 | 846,00 |
| 1 | 2 | 4 | 6 648,00 | 7 530,00 | 60000,00 | 48,00 |
| 5 | 2 | 4 | 23 220,00 | 23 070,00 | 1172,00 | 48,00 |
| 25 | 2 | 4 | 28 867,00 | 20 492,00 | 60000,00 | 49,00 |
| 1 | 4 | 8 | 11 621,00 | 11 624,00 | 1372,00 | 48,00 |
| 5 | 4 | 8 | 23 300,00 | 23 216,00 | 4730,00 | 48,00 |
| 8 | 4 | 8 | 22 300,00 | 20 869,00 | 60000,00 | 49,00 |
Same as with MongoDB, if you require a very basic message queue implementation without a lot of traffic, and already have a replicated PostgreSQL instance in your deployment, such an implementation might be a good choice. Things to look out for in this case are long processing latencies and manual failover, unless third-party extensions are used.
Event Store
| Version | 20.6.1, JVM client 7.3.0 |
| Replication | synchronous |
| Replication type | active-passive |
EventStore is first and foremost a database for event sourcing and complex event processing. However, it also supports the competing consumers pattern, or as we know it: message queueing. How does it stack up comparing to other message brokers?
EventStore offers a lot in terms of creating event streams, subscribing to them and transforming through projections. In the tests we'll only be writing events to a stream (each message will become an event), and create persistent subscriptions (that is, subscriptions where the consumption state is stored on the server) to read events on the clients. You can read more about event sourcing, competing consumers and subscription types in the docs.
To safely replicate data, EventStore uses quorum-based replication, using a gossip protocol to disseminate knowledge about the cluster state. A majority of nodes has to confirm every write for it to be considered successful. That’s also how resilience against split brain is implemented.
As all of the tests are JVM-based, we'll be using the JVM client, which is built on top of Akka and hence fully non-blocking. However, the test framework is synchronous - because of that, the EventStoreMq implementation hides the asynchronous nature behind synchronous sender and receiver interfaces. Even though the tests will be using multiple threads, all of them will be using only one connection to EventStore per node.
Comparing to the default configuration, the client has a few modified options:
readBatchSize,historyBufferSizeandmaxCheckPointSizeare all bumped to1000to allow more messages to be pre-fetched- the in-flight messages buffer size is increased from the default
10to a1000. As this is by default not configurable in the JVM client, we had to copy some code from the driver and adjust the properties (see theMyPersistentSubscriptionActorclass)
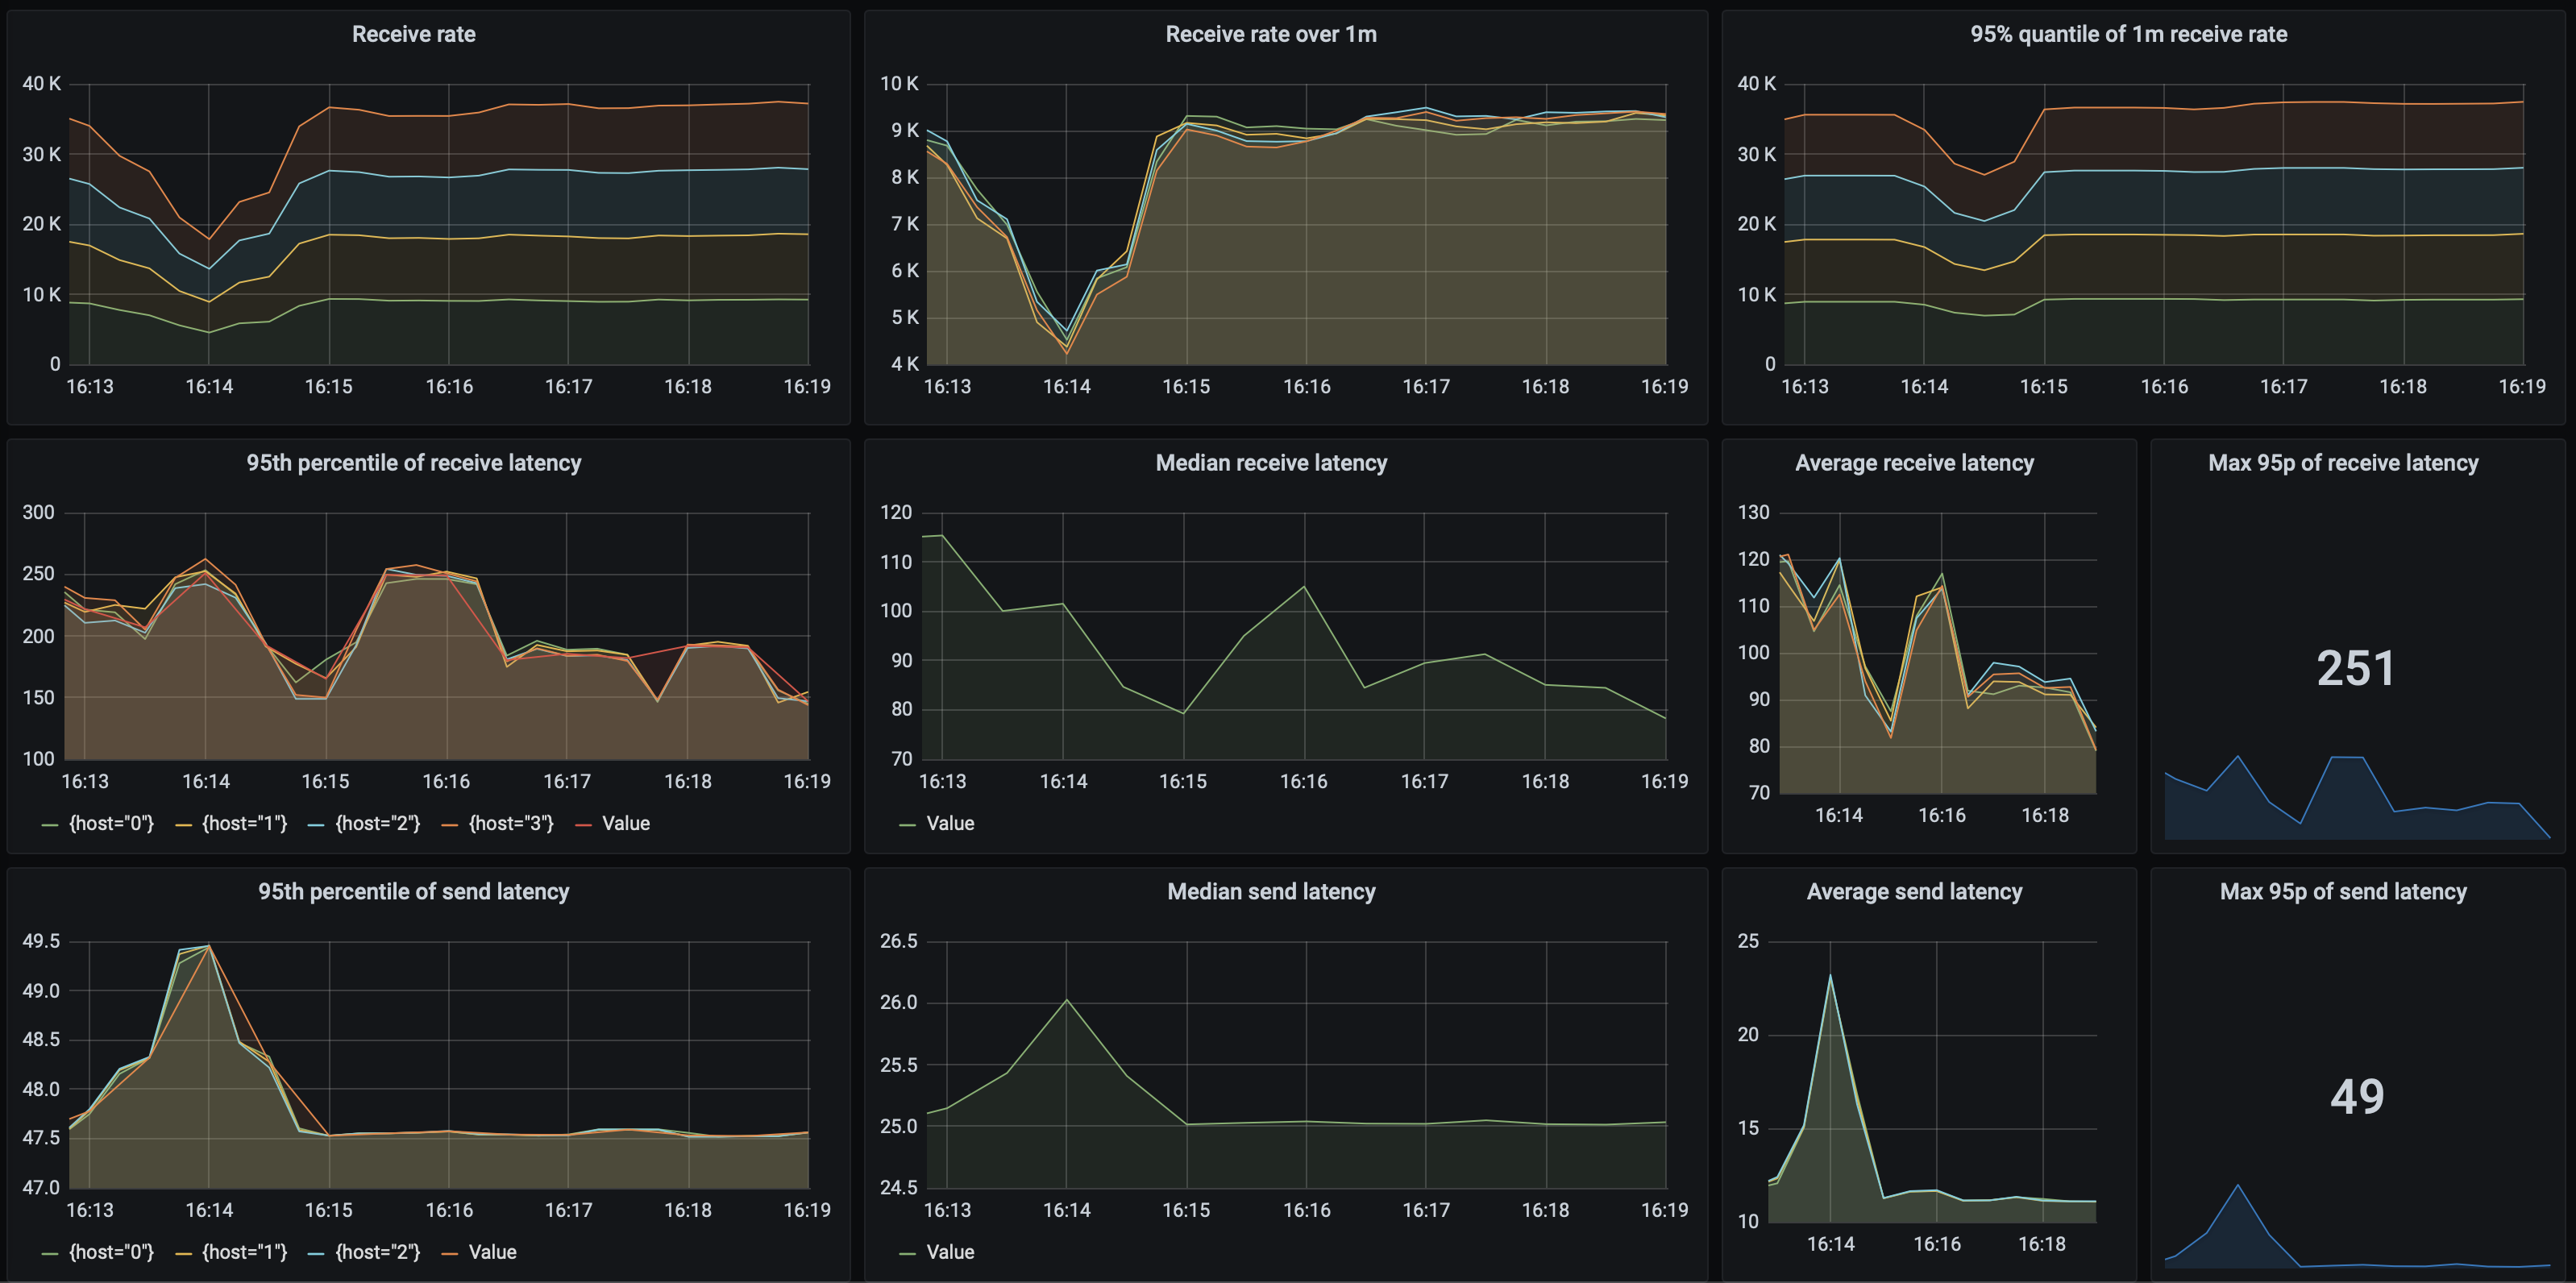
How does EventStore perform? A baseline setup achieves 793 msgs/s, and when using 3 sender with 25 threads, and 4 receiver nodes, in the tests we have achieved a throughput of 33 427 msgs/s with the 95th percentile of processing latency being at most 251 ms and the send latency 49 ms. Receive rates are stable, as are the latencies:
Here's a summary of the EventStore tests that we've run:
| Threads | Sender nodes | Receiver nodes | Send msgs/s | Receive msgs/s | Processing latency | Send latency |
|---|---|---|---|---|---|---|
| 1 | 1 | 2 | 793,00 | 792,00 | 116,00 | 48,00 |
| 25 | 1 | 2 | 16 243,00 | 16 241,00 | 123,00 | 48,00 |
| 25 | 2 | 4 | 29 076,00 | 29 060,00 | 128,00 | 48,00 |
| 25 | 3 | 4 | 33 427,00 | 33 429,00 | 251,00 | 49,00 |
| 25 | 4 | 4 | 29 321,00 | 27 792,00 | 60000,00 | 48,00 |
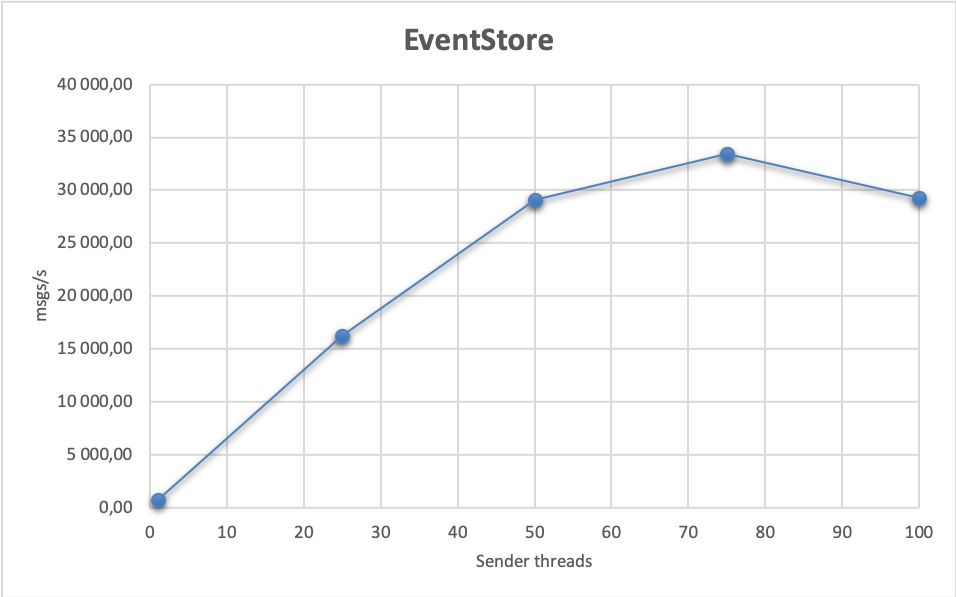
EventStore also provides a handy web console. Comparing to the other general-purpose databases (PostgreSQL and MongoDB), EventStore offers the best performance, but it’s also the most specialised, oriented towards working with event streams in the first place.
SQS
| Version | Amazon Java SDK 1.11.797 |
| Replication | ? |
| Replication type | ? |
SQS, Simple Message Queue, is a message-queue-as-a-service offering from Amazon Web Services. It supports only a handful of messaging operations, far from the complexity of e.g. AMQP, but thanks to the easy to understand interfaces, and the as-a-service nature, it is very useful in a number of situations.
The primary interface to access SQS and send messages is using an SQS-specific HTTP API. SQS provides at-least-once delivery. It also guarantees that if a send completes, the message is replicated to multiple nodes; quoting from the website:
"Amazon SQS runs within Amazon's high-availability data centers, so queues will be available whenever applications need them. To prevent messages from being lost or becoming unavailable, all messages are stored redundantly across multiple servers and data centers."
When receiving a message, it is blocked from other receivers for a period of time called the visibility timeout. If the message isn’t deleted (acknowledged) before that time passes, it will be re-delivered, as the system assumes that previous processing has failed. SQS also offers features such as deduplication ids and FIFO queues. For testing, the ElasticMQ projects offers an in-memory implementation.
We don't really know how SQS is implemented, but it most probably spreads the load across many servers, so including it here is a bit of an unfair competition: the other systems use a single fixed 3-node replicated cluster, while SQS can employ multiple replicated clusters and route/balance the messages between them. Still, it might be interesting to compare to self-hosted solutions.
A baseline single thread setup achieves 592 msgs/s sent and the same number of msgs received, with a processing latency of 113 ms and send latency of 49 ms.
These results are not impressive, but SQS scales nicely both when increasing the number of threads, and the number of nodes. On a single node, with 50 threads, we can send up to 22 687 msgs/s, and receive on two nodes up to 14 423 msgs/s.
With 12 sender and 24 receiver nodes, these numbers go up to 130 956 msgs/s sent, and 130 976 msgs/s received! However, at these message rates, the service costs might outweigh the costs of setting up a self-hosted message broker.
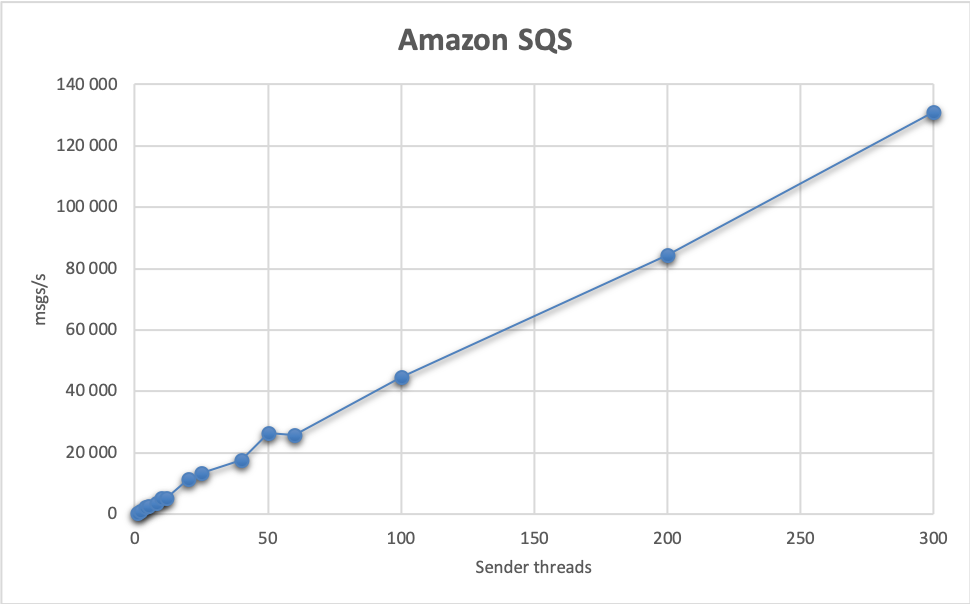
As for latencies, SQS can be quite unpredictable compared to other queues which we’ll cover later. We've observed processing latency from 94 ms up to 1 960 ms. Send latencies are more constrained and are usually around 50 ms.
Here's the dashboard for the test using 4 nodes, each running 5 threads.
And full test results:
| Threads | Sender nodes | Receiver nodes | Send msgs/s | Receive msgs/s | Processing latency | Send latency |
|---|---|---|---|---|---|---|
| 1 | 1 | 2 | 528,00 | 529,00 | 113,00 | 49,00 |
| 5 | 1 | 2 | 2 680,00 | 2 682,00 | 277,00 | 49,00 |
| 25 | 1 | 2 | 13 345,00 | 13 370,00 | 1 960,00 | 49,00 |
| 50 | 1 | 2 | 22 687,00 | 14 423,00 | 60 000,00 | 49,00 |
| 1 | 2 | 4 | 1 068,00 | 1 068,00 | 97,00 | 49,00 |
| 5 | 2 | 4 | 5 383,00 | 5 377,00 | 106,00 | 49,00 |
| 25 | 2 | 4 | 26 576,00 | 26 557,00 | 302,00 | 49,00 |
| 1 | 4 | 8 | 2 244,00 | 2 245,00 | 97,00 | 48,00 |
| 5 | 4 | 8 | 11 353,00 | 11 356,00 | 90,00 | 48,00 |
| 25 | 4 | 8 | 44 586,00 | 44 590,00 | 256,00 | 50,00 |
| 1 | 8 | 16 | 3 651,00 | 3 651,00 | 97,00 | 50,00 |
| 5 | 8 | 16 | 17 575,00 | 17 577,00 | 94,00 | 50,00 |
| 25 | 8 | 16 | 84 512,00 | 84 512,00 | 237,00 | 50,00 |
| 1 | 12 | 24 | 5 168,00 | 5 168,00 | 96,00 | 50,00 |
| 5 | 12 | 24 | 25 735,00 | 25 738,00 | 94,00 | 50,00 |
| 25 | 12 | 24 | 130 956,00 | 130 976,00 | 213,00 | 50,00 |
RabbitMQ
| Version | 3.8.5-1, java amqp client 5.9.0 |
| Replication | synchronous |
| Replication type | active-passive |
RabbitMQ is one of the leading open-source messaging systems. It is written in Erlang, implements AMQP and is a very popular choice when messaging is involved; using RabbitMQ it is possible to define complex message delivery topologies. It supports both message persistence and replication.
We'll be testing a 3-node Rabbit cluster, using quorum queues, which are a relatively new addition to what RabbitMQ offers. Quorum queues are based on the Raft consensus algorithm; a leader is automatically elected in case of node failure, as long as a majority of nodes are available. That way, data is safe also in case of network partitions.
To be sure that sends complete successfully, we'll be using publisher confirms, a Rabbit extension to AMQP, instead of transactions:
"Using standard AMQP 0-9-1, the only way to guarantee that a message isn't lost is by using transactions -- make the channel transactional, publish the message, commit. In this case, transactions are unnecessarily heavyweight and decrease throughput by a factor of 250. To remedy this, a confirmation mechanism was introduced."
A message is confirmed after it has been replicated to a majority of nodes (this is where Raft is used). Moreover, messages have to be written to disk and fsynced.
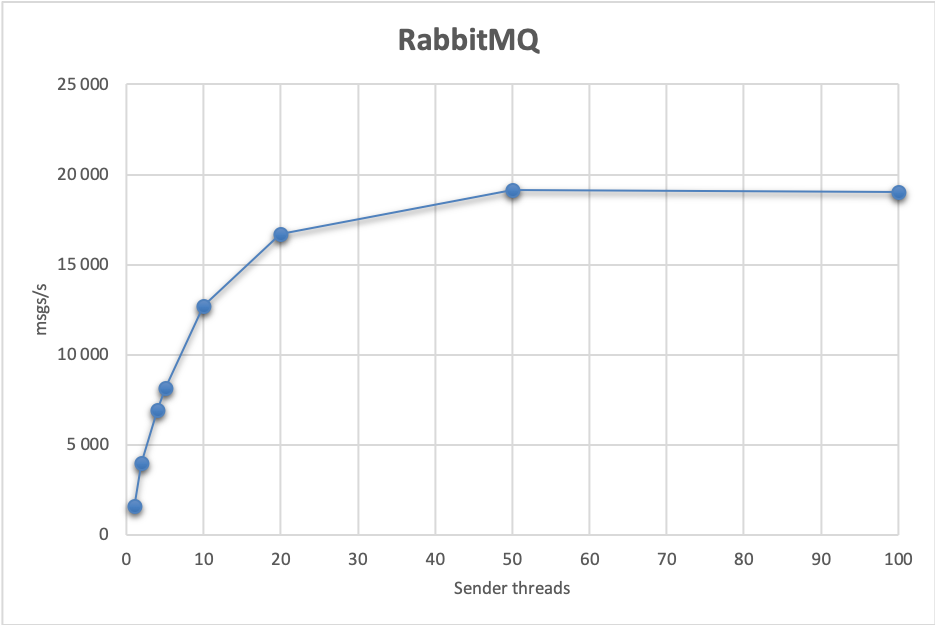
Such strong guarantees are probably one of the reasons for mediocre performance. A basic single-thread setup achieves around 2 000 msgs/s sent&received, with a processing latency of 18 000 ms and send latency of 48 ms. The queue can be scaled up to 19 000 msgs/s using 25 threads, 4 sender nodes and 8 receiver nodes:
| Threads | Sender nodes | Receiver nodes | Send msgs/s | Receive msgs/s | Processing latency | Send latency |
|---|---|---|---|---|---|---|
| 1 | 1 | 2 | 2 064,00 | 1 991,00 | 18 980,00 | 48,00 |
| 5 | 1 | 2 | 8 146,00 | 8 140,00 | 98,00 | 48,00 |
| 25 | 1 | 2 | 17 334,00 | 17 321,00 | 122,00 | 48,00 |
| 1 | 2 | 4 | 3 994,00 | 3 983,00 | 1 452,00 | 48,00 |
| 5 | 2 | 4 | 12 714,00 | 12 730,00 | 99,00 | 48,00 |
| 25 | 2 | 4 | 19 120,00 | 19 126,00 | 142,00 | 48,00 |
| 1 | 4 | 8 | 6 939,00 | 6 941,00 | 98,00 | 48,00 |
| 5 | 4 | 8 | 16 687,00 | 16 685,00 | 116,00 | 48,00 |
| 25 | 4 | 8 | 19 035,00 | 19 034,00 | 190,00 | 71,00 |
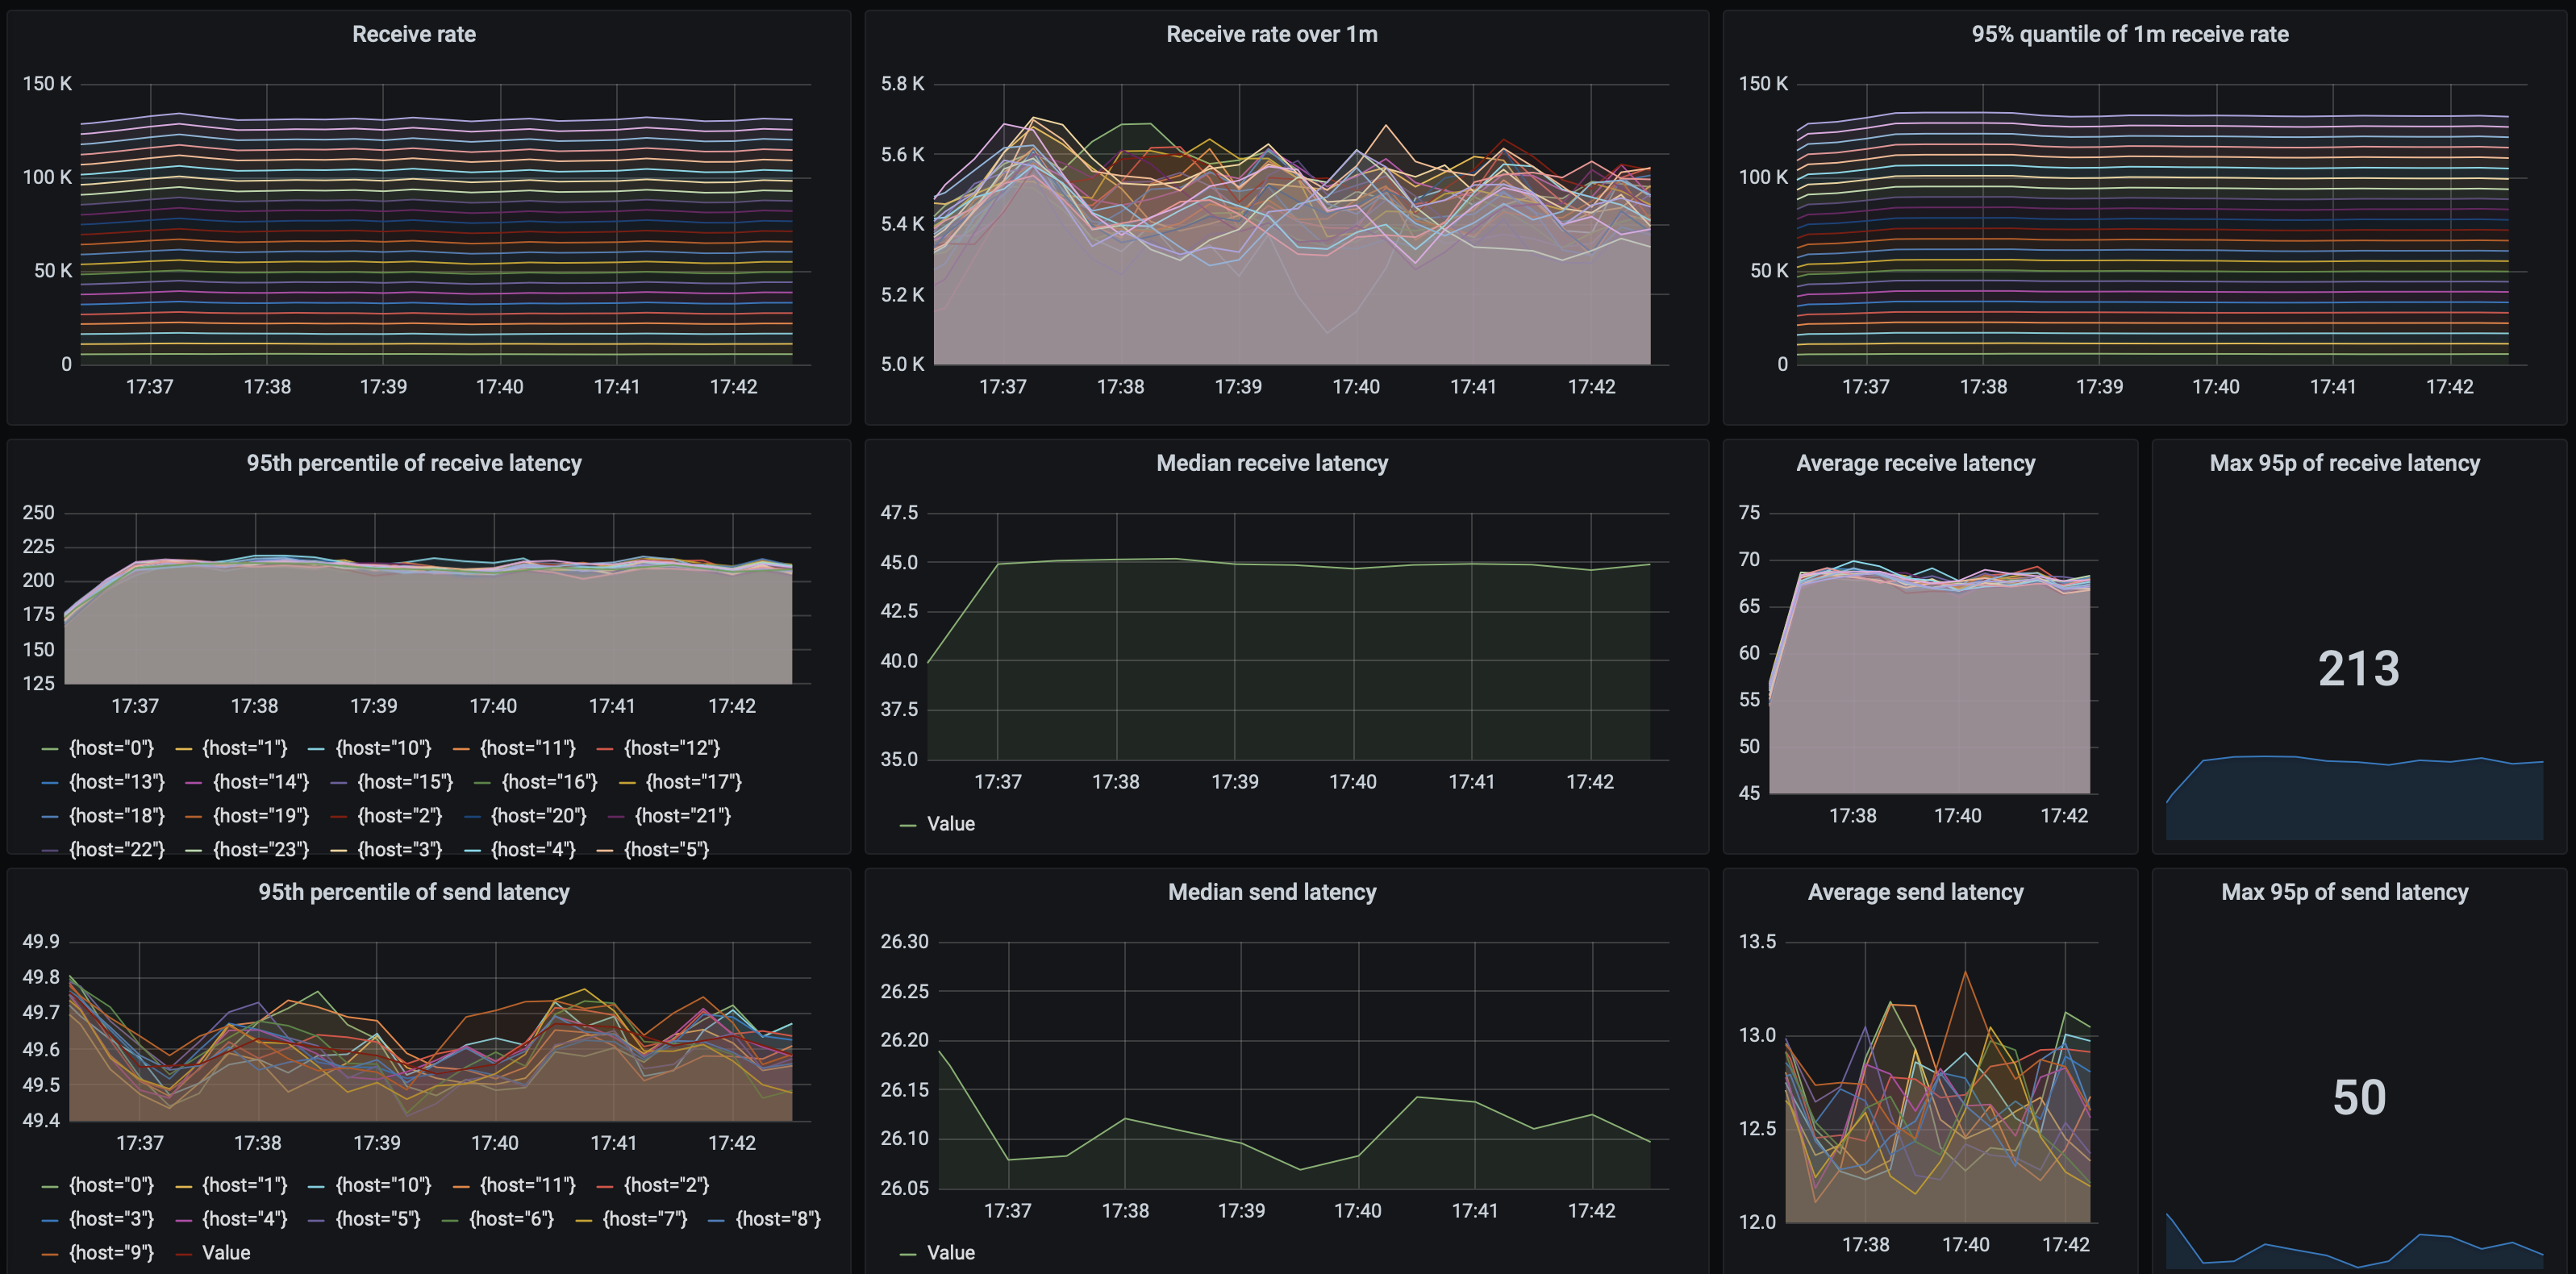
Let’s take a closer look at the test which achieves highest performance:
As you can see, the receive rate, send and processing latencies are quite stable - which is also an important characteristic to examine under load. The processing latency is around 190 ms, while the send latency in this case is 71 ms.
Note that messages are always sent and received at the same rate, which would indicate that message sending is the limiting factor when it comes to throughput. Rabbit's performance is a consequence of some of the features it offers, for a comparison with Kafka see for example this Quora question.
The RabbitMq implementation of the Mq interface is again pretty straightforward. We are using the mentioned publisher confirms, and setting the quality-of-service when receiving so that at most 100 messages are delivered unconfirmed (in-flight).
An important side-node: RabbitMQ has a great web-based console, available with almost no setup, which offers some very good insights into how the queue is performing.
ActiveMQ Artemis
| Version | 2.15.0, java driver 2.15.0 |
| Replication | synchronous |
| Replication type | active-passive |
Artemis is the successor to popular ActiveMQ 5 (which hasn’t seen any significant development lately). Artemis emerged from a donation of the HornetQ code to Apache, and is being developed by both RedHat and ActiveMQ developers. Like RabbitMQ, it supports AMQP, as well as other messaging protocols, for example STOMP and MQTT.
Artemis supports a couple of high availability deployment options, either using replication or a shared store. We’ll be using the over-the-network setup, that is replication.
Unlike other tested brokers, Artemis replicates data to one backup node. The basic unit here is a live-backup pair. The backup happens synchronously, that is a message is considered sent only when it is replicated to the other server. Failover and failback can be configured to happen automatically, without operator intervention.
Moreover, queues in Artemis can be sharded across multiple live-backup pairs. That is, we can deploy a couple of such pairs and use them as a single cluster. As we aren’t able to create a three-node cluster, instead we’ll use a six-node setup in a “star” configuration: three live (leader) servers, all of which serve traffic of the queue used for tests. Each of them has a backup server.
Split-brain issues are addressed by an implementation of quorum voting. This is similar to what we’ve seen e.g. in the RabbitMQ implementation.
The Artemis test client code is based on JMS, and doesn’t contain any Artmis-specific code - uses only standard JMS concepts - sending messages, receiving and transactions. We only need to use an Artemis-specific connection factory, see ArtemisMq.
The configuration changes comparing to the default are:
- the
Xmxjava parameter bumped to48G - in
broker.xml, theglobal-max-sizesetting changed to48G journal-typeset toMAPPEDjournal-datasync,journal-sync-non-transactionalandjournal-sync-transactionalall set tofalse
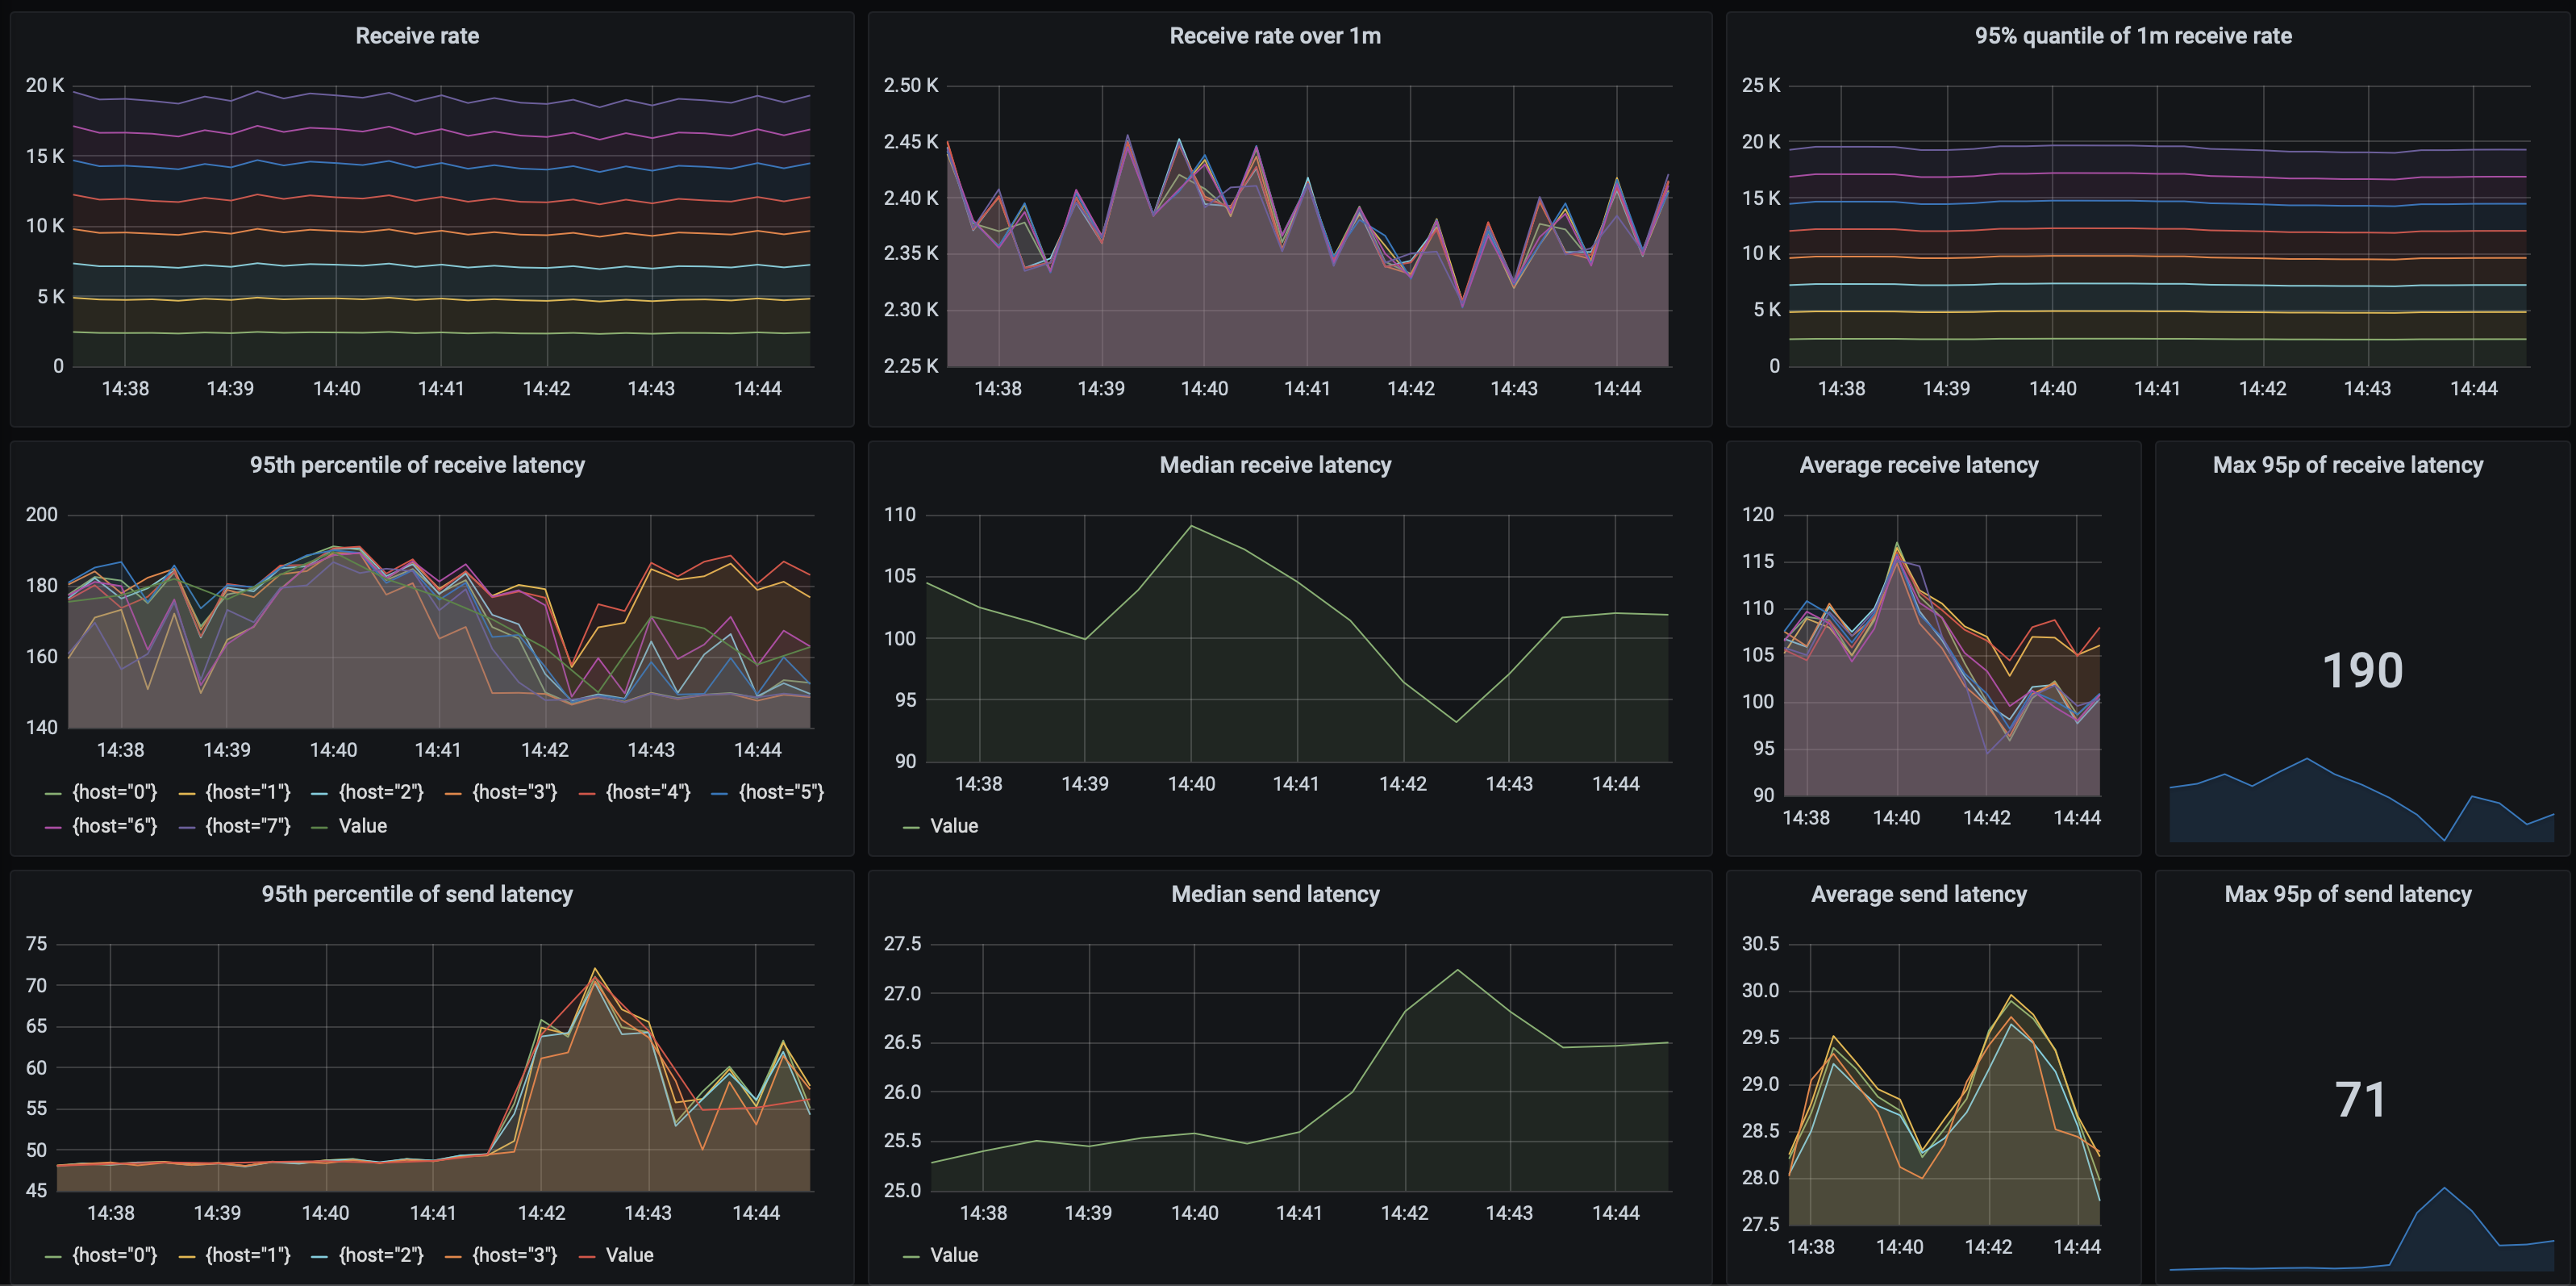
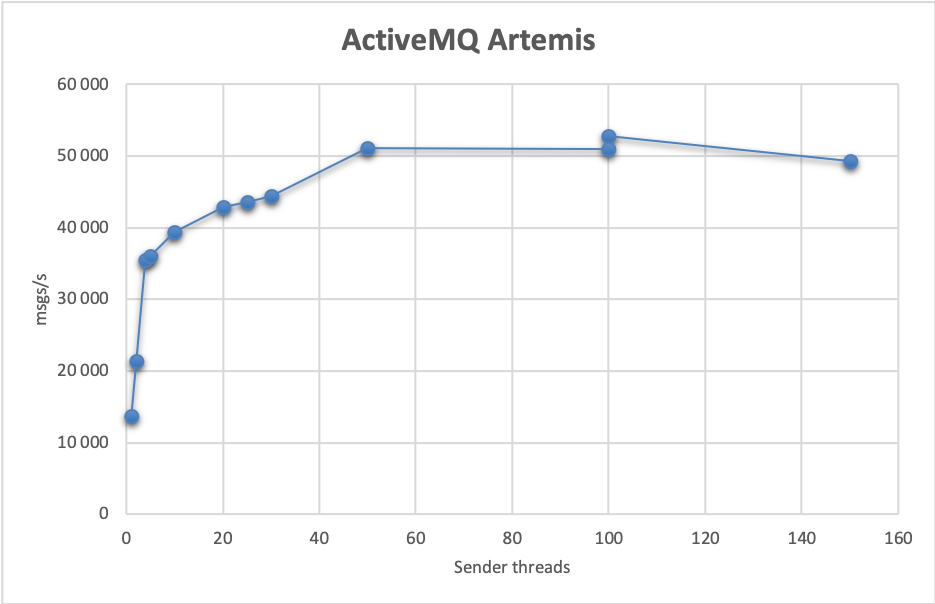
Performance wise, Artemis does very well. Our baseline single-thread setup achieves 13 650 msgs/s. By adding nodes, we can scale that result to 52 820 msgs/s using 4 sending nodes, 8 receiver nodes each running 25 threads:
In that last case, the 95th percentile of send latency is a stable 48 ms and maximum processing latency of 49 ms:
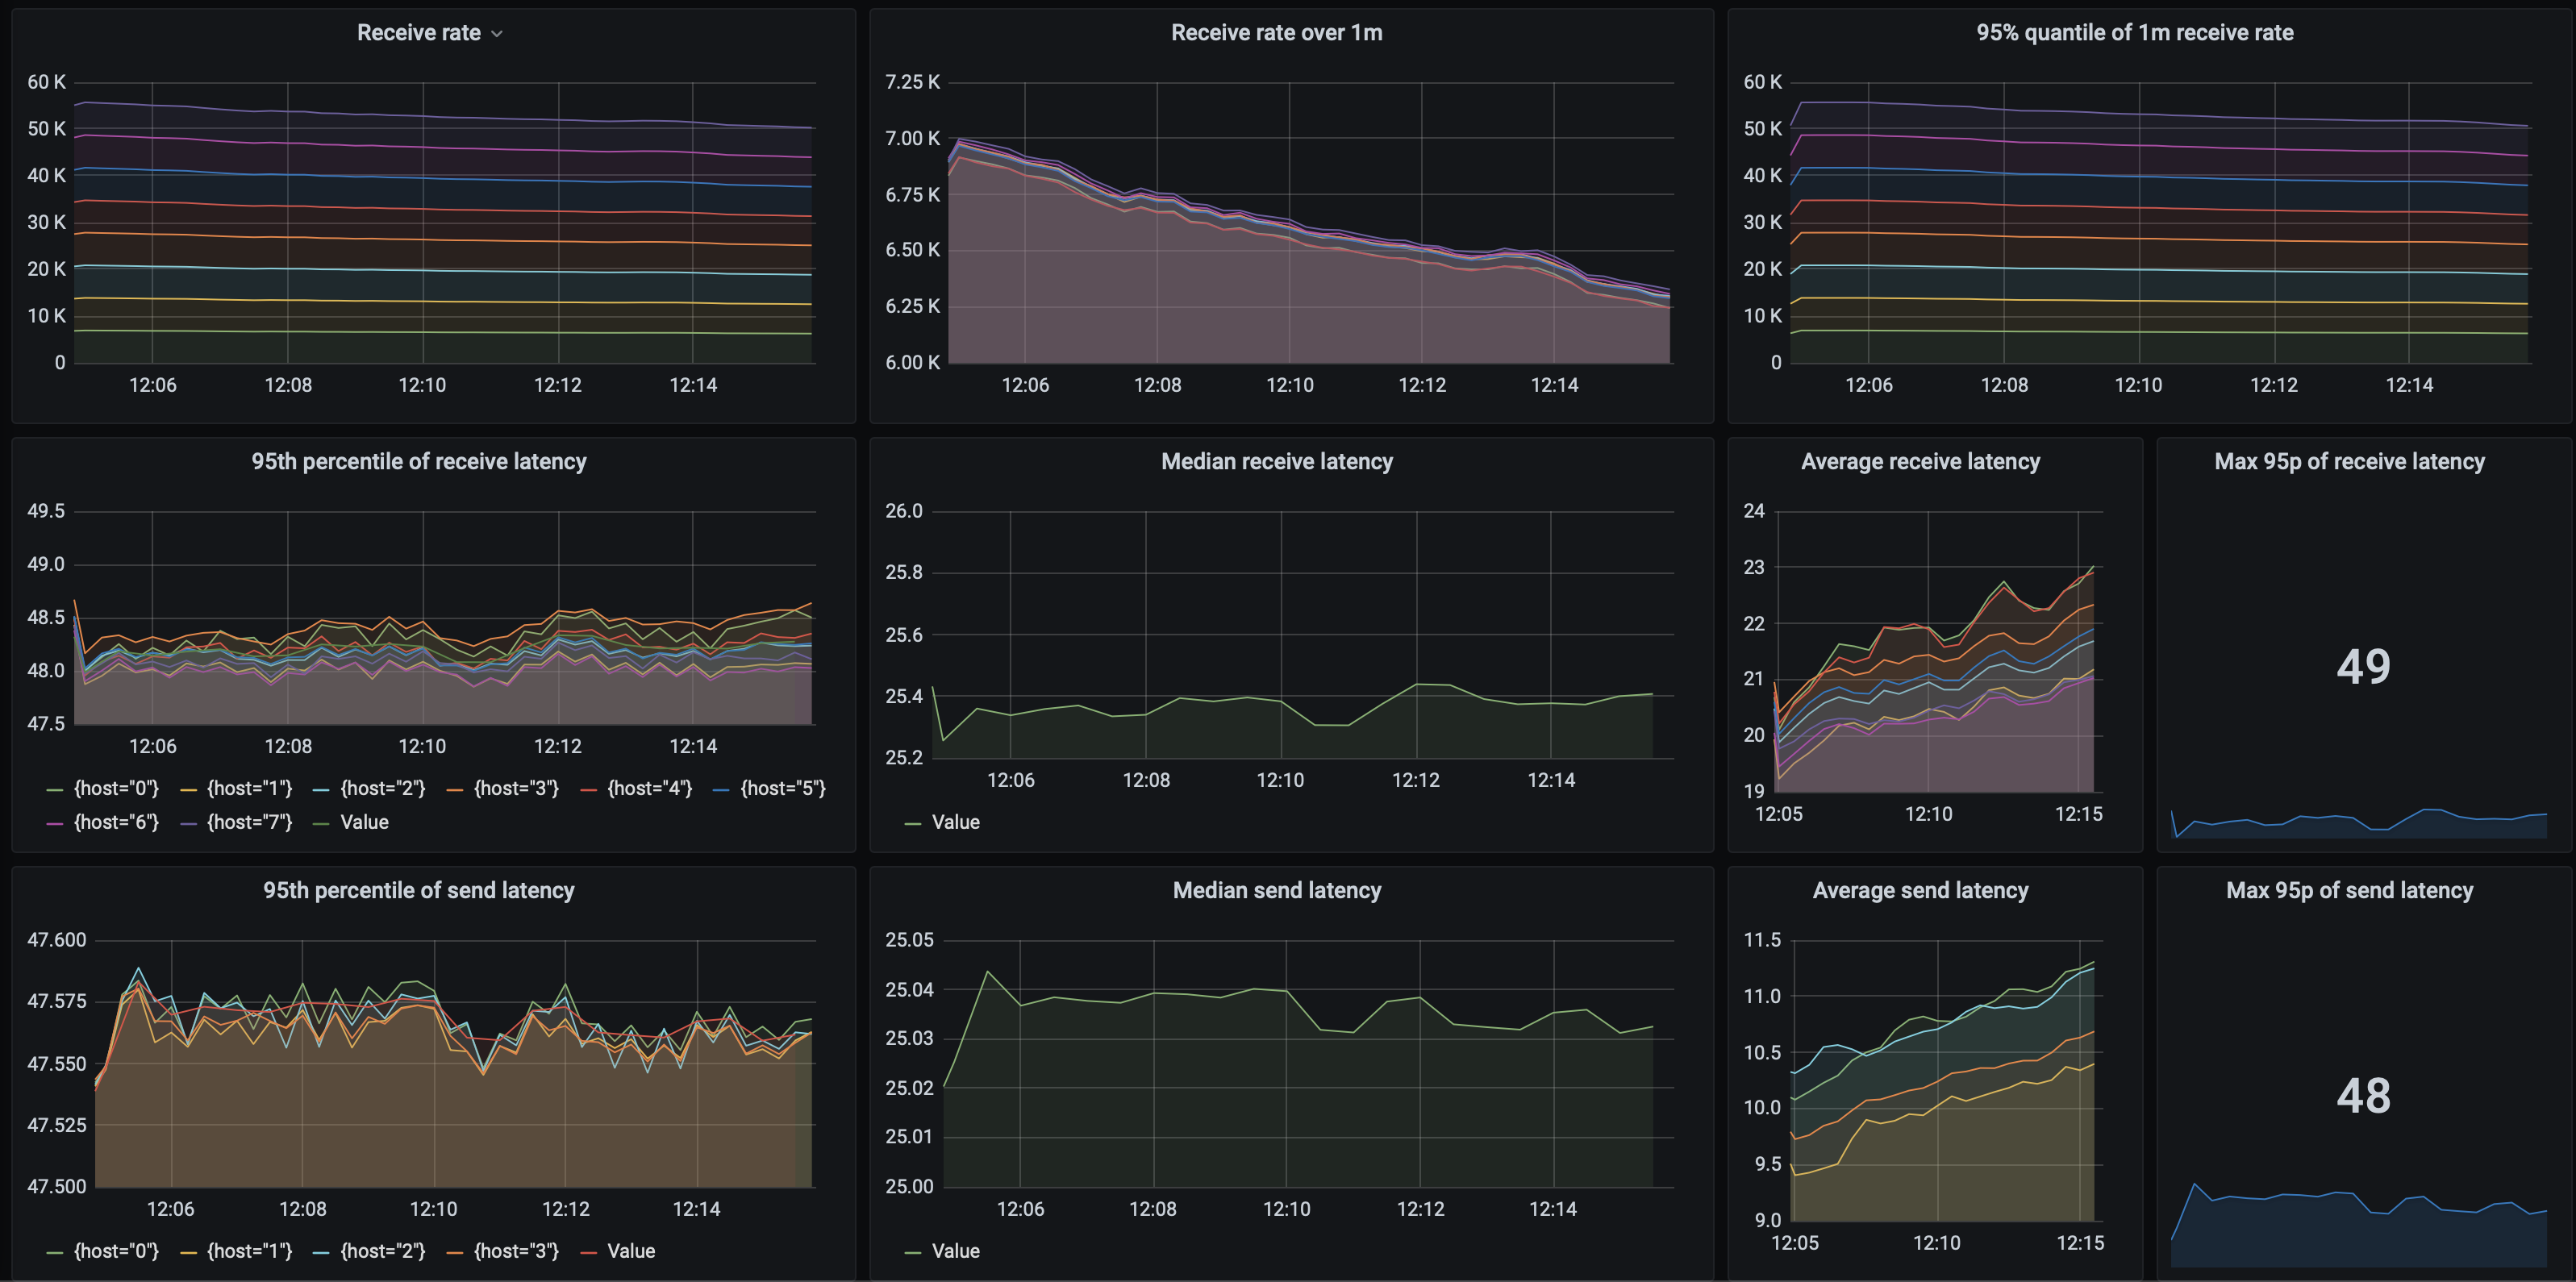
However, as the Artemis team noted, the addressing model currently implemented in Artemis isn't the best fit for the mqperf benchmark. Consuming messages from a single queue on a single broker is basically a single-thread process - which on one hand ensures that messages are consumed in-order, but on the other prevents scaling as more consumers are added (quite the contrary!). This can be alleviated by using dedicated queues for consumers, or broadcast topics with filtering, however we then need application-side coordination code which assigns queues to consumers, ensures that there's at least one consumer for each queue, and performs rebalancing on failure.
Here are all of the results:
| Threads | Sender nodes | Receiver nodes | Send msgs/s | Receive msgs/s | Processing latency | Send latency |
|---|---|---|---|---|---|---|
| 1 | 1 | 2 | 13 647,00 | 13 648,00 | 48,00 | 44,00 |
| 5 | 1 | 2 | 36 035,00 | 36 021,00 | 47,00 | 46,00 |
| 25 | 1 | 2 | 43 643,00 | 43 630,00 | 48,00 | 48,00 |
| 1 | 2 | 4 | 21 380,00 | 21 379,00 | 47,00 | 45,00 |
| 5 | 2 | 4 | 39 320,00 | 39 316,00 | 48,00 | 47,00 |
| 25 | 2 | 4 | 51 089,00 | 51 090,00 | 48,00 | 48,00 |
| 1 | 4 | 8 | 35 538,00 | 35 525,00 | 47,00 | 46,00 |
| 5 | 4 | 8 | 42 881,00 | 42 882,00 | 48,00 | 47,00 |
| 25 | 4 | 8 | 52 820,00 | 52 826,00 | 49,00 | 48,00 |
| 5 | 6 | 12 | 44 435,00 | 44 436,00 | 48,00 | 48,00 |
| 25 | 6 | 12 | 49 279,00 | 49 278,00 | 77,00 | 48,00 |
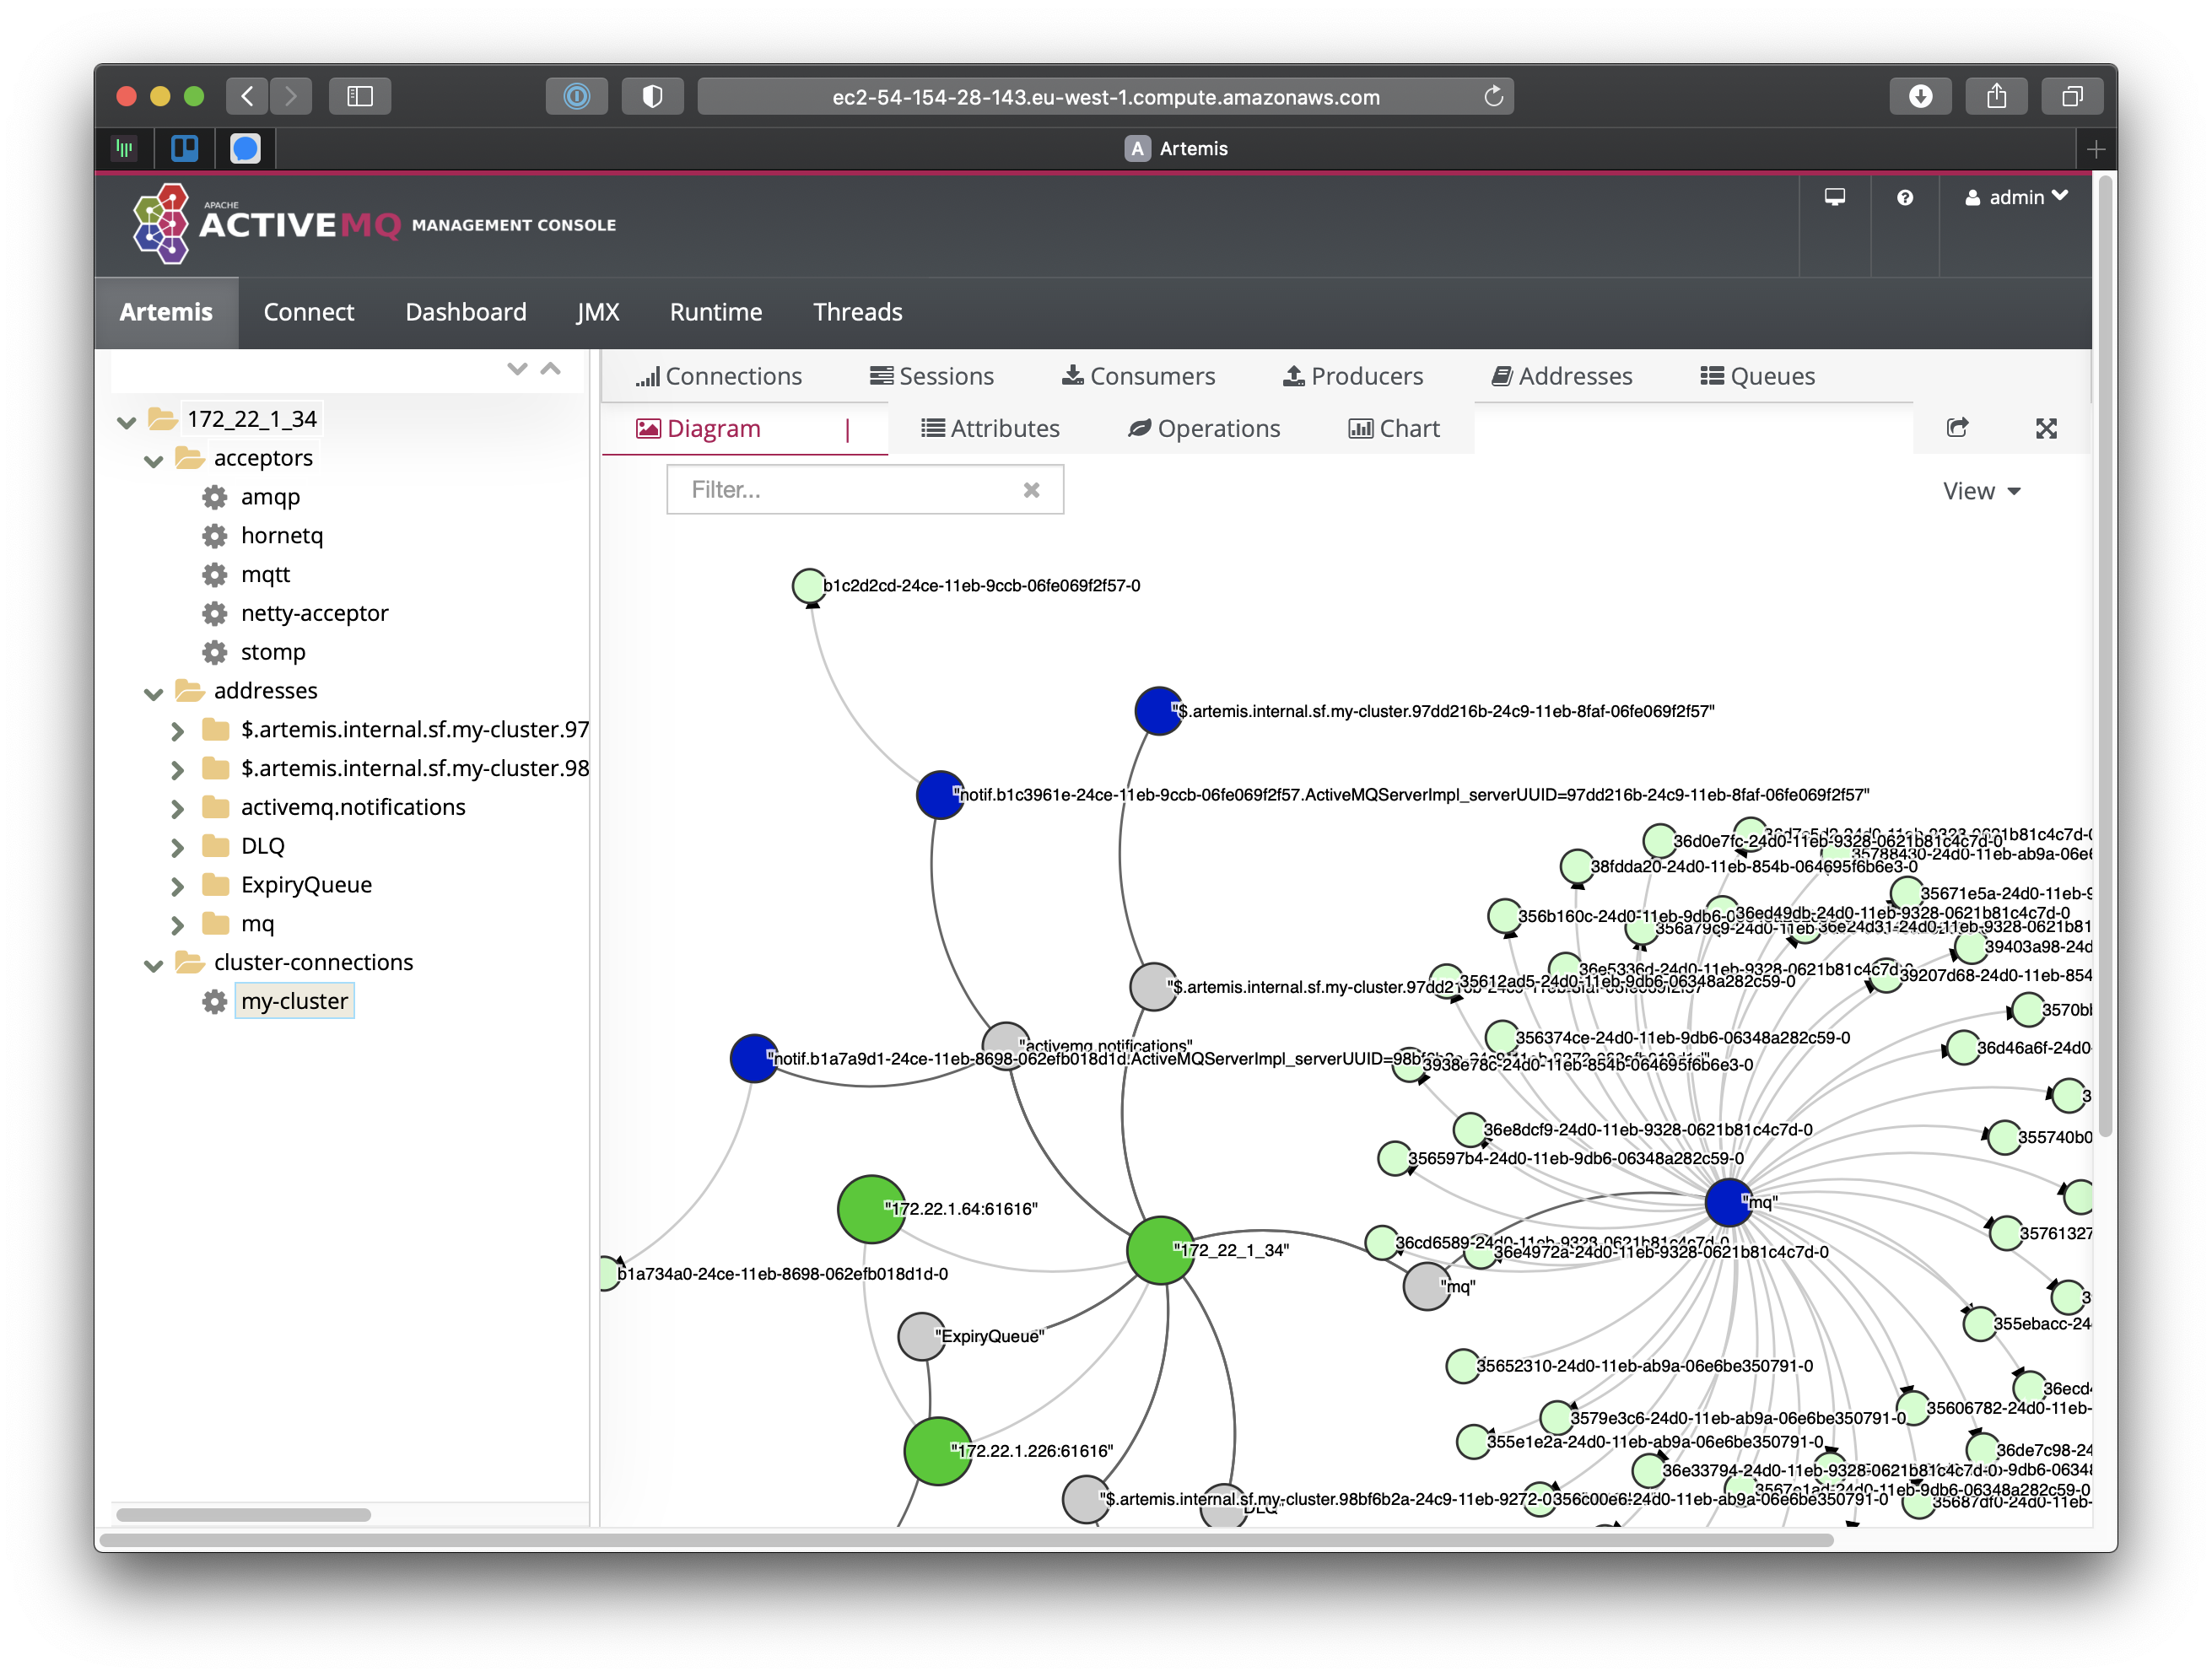
Artemis also offers a web console which helps to visualise the current cluster state.
NATS Streaming
| Version | 0.19.0, java driver 2.2.3 |
| Replication | synchronous |
| Replication type | active-passive |
NATS is a lightweight messaging system, popular especially in the domain of IoT applications. It supports a number of communication patterns, such as request-reply, publish-subscribe and wildcard subscriptions. NATS offers clients in most popular languages, as well as integrations with many external systems. However, in itself, NATS doesn’t offer clustering, replication or message acknowledgments.
For that purpose, NATS Streaming builds upon NATS, providing support for replicated, persistent messaging, durable subscriptions and, using acknowledgements, guarantees at-least-once delivery. It embeds a NATS server, extending its protocol with additional capabilities.
A NATS Streaming server stores an ever-growing log of messages, which are deleted after reaching the configured size, message count or message age limit (in this respect, the design is similar to a Kafka topic’s retention policy). The server is simple to setup - not a lot of configuration is needed. The client APIs are similarly straightforward to use.
As with other queue implementations discussed previously, NATS Streaming uses the Raft protocol for replicating data in a cluster. A write is successful only after a successful consensus round - when the majority of nodes accept it. Hence, this design should be resilient against split-brain scenarios.
There’s a single leader node, which accepts writes. This means (as the documentation emphasises), that this setup isn’t horizontally scalable. An alternate version of a NATS-based clustered system - JetStream is being developed, which promises horizontal scalability.
What’s interesting is a whole section in the docs dedicated to the use-cases of at-least-once, persistent messaging - when to use it, and more importantly, when not to use it:
Just be aware that using an at least once guarantee is the facet of messaging with the highest cost in terms of compute and storage. The NATS Maintainers highly recommend a strategy of defaulting to core NATS using a service pattern (request/reply) to guarantee delivery at the application level and using streaming only when necessary.
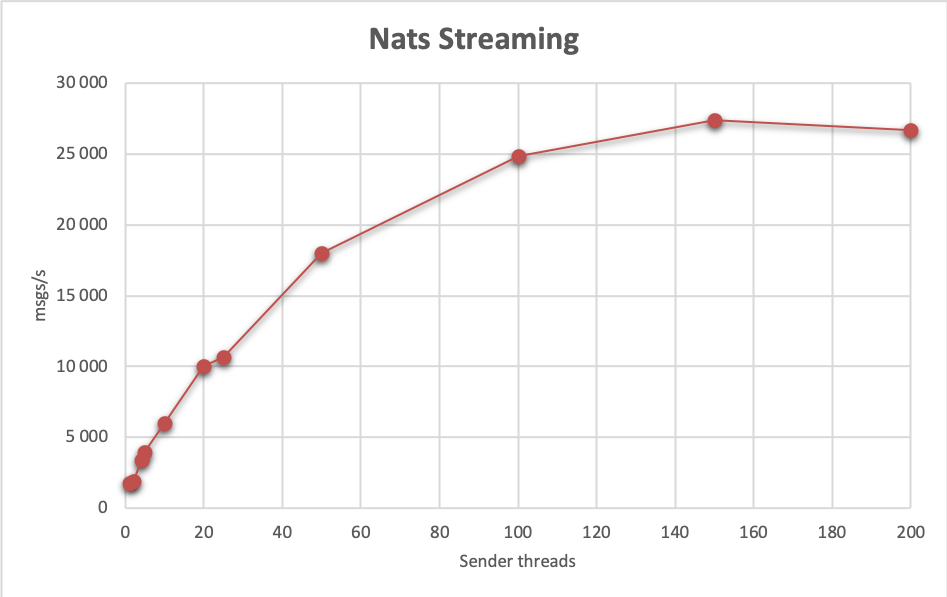
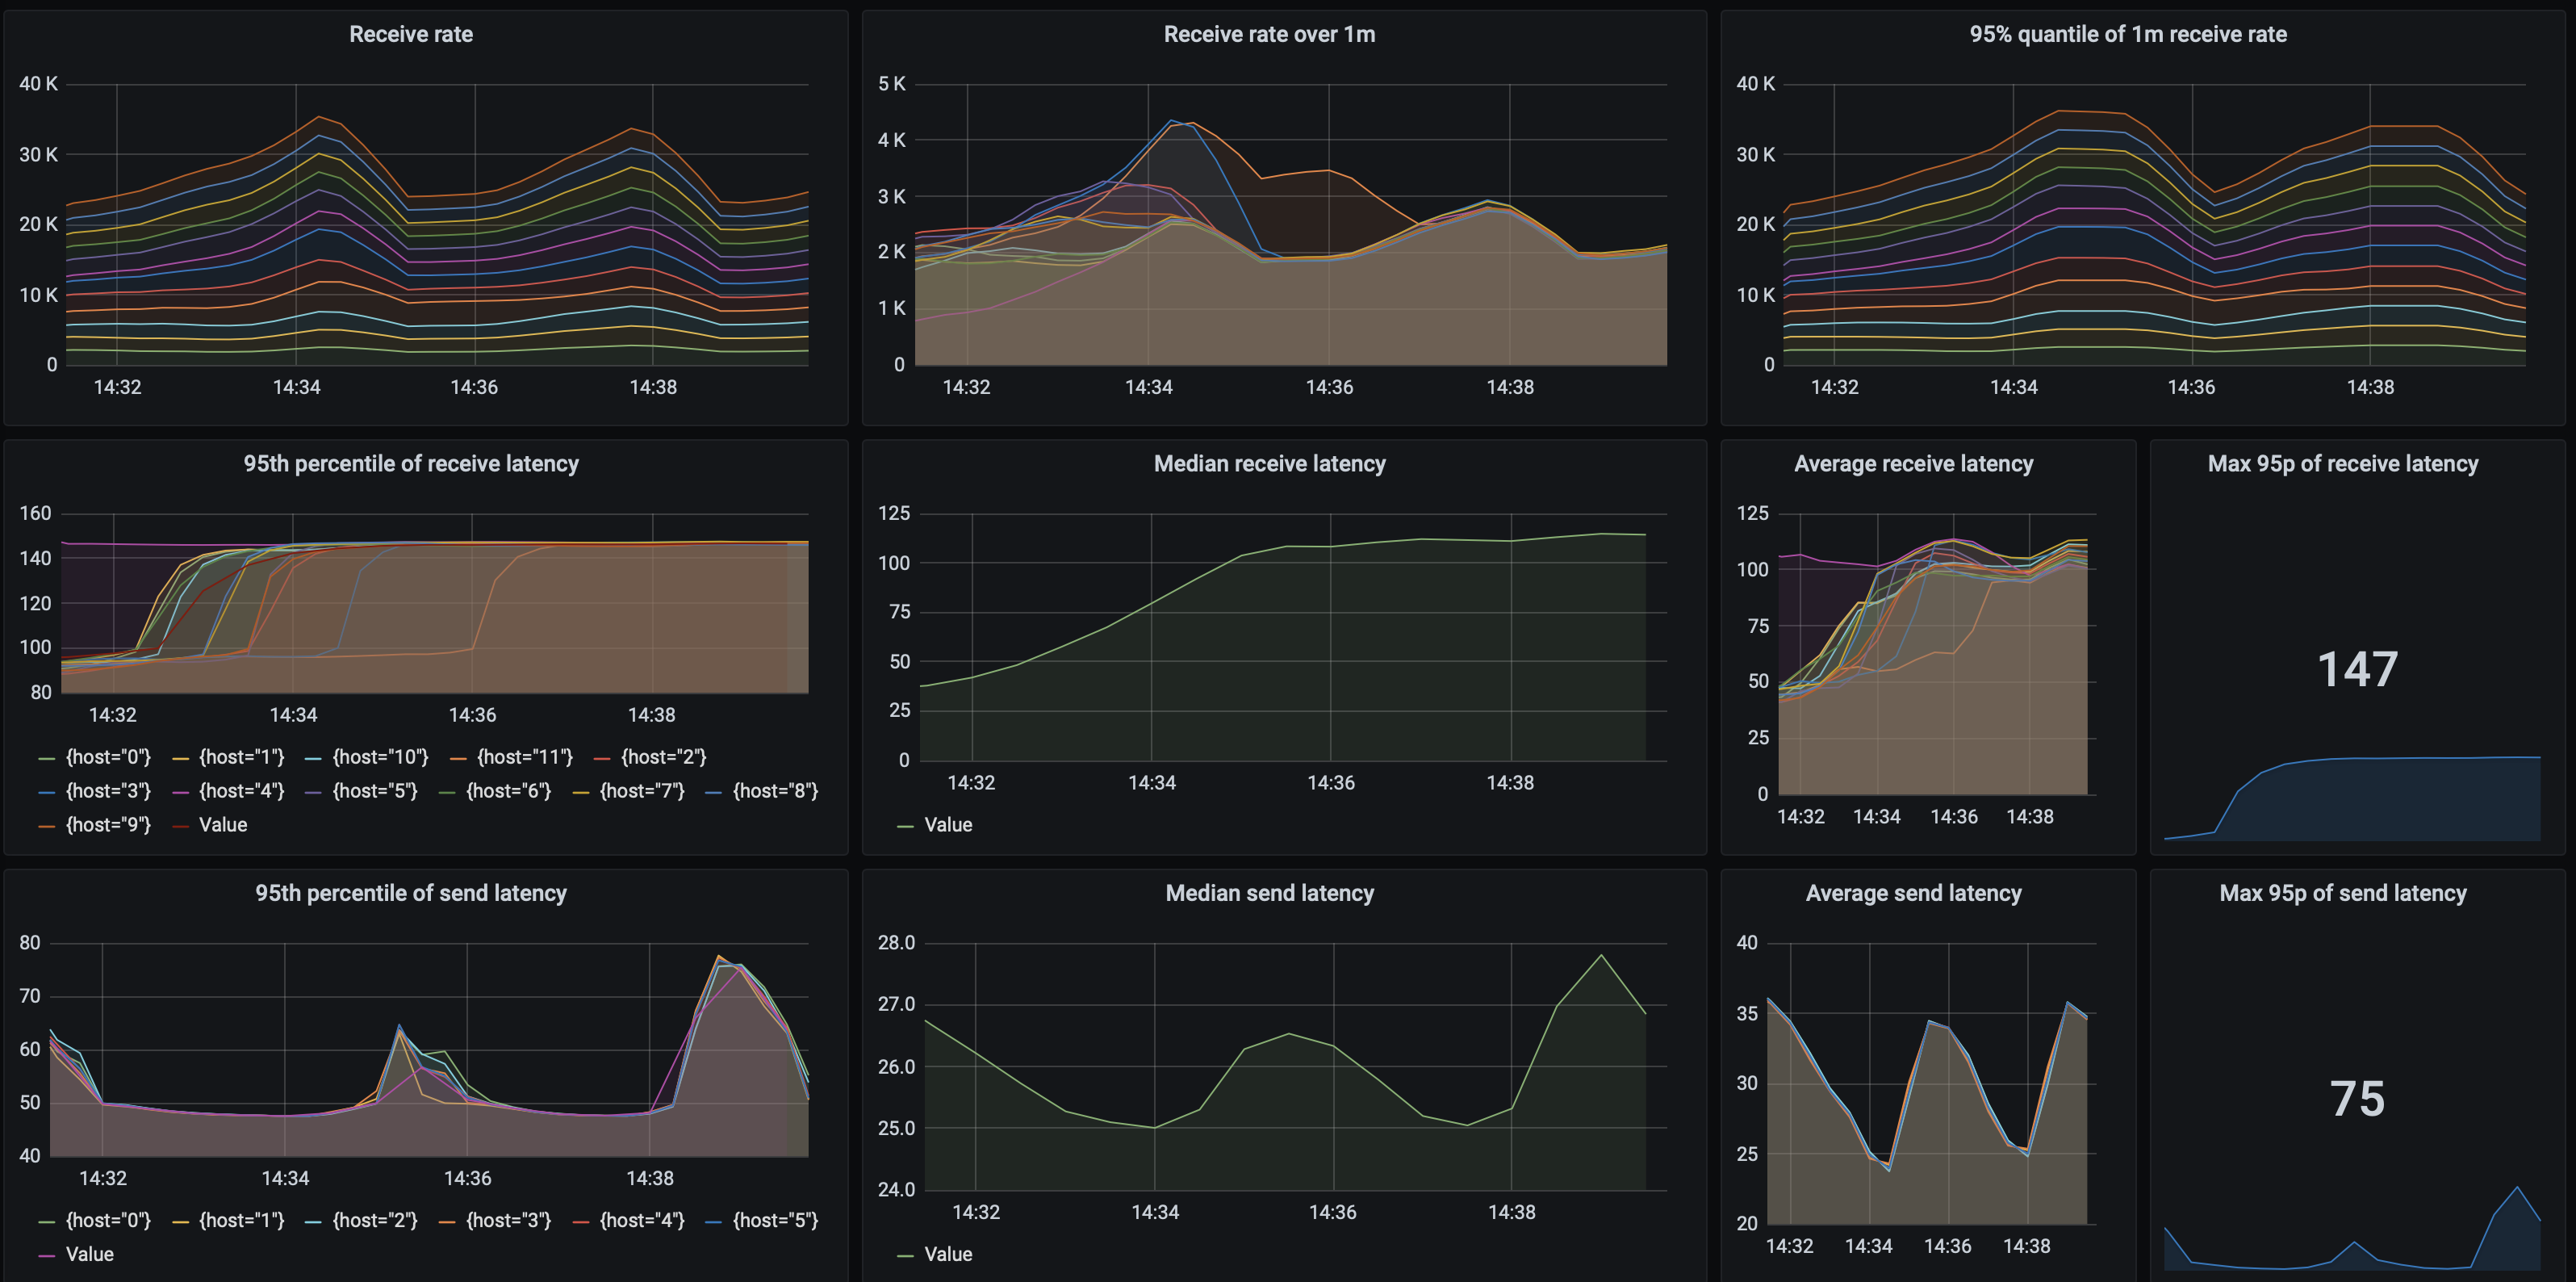
It’s always good to consider your architectural requirements, but in our tests of course we’ll focus on the replicated & persistent setup. Speaking of tests, our baseline test achieved 1 725 msgs/s. This scales up to 27 400 msgs/s when using 25 threads on 6 senders nodes, and 12 receiver nodes.
Latencies are also looking good, with 95th send percentile being at most 95 ms, while messages have been usually processed within 148 ms.
Here’s a summary of the test runs:
| Threads | Sender nodes | Receiver nodes | Send msgs/s | Receive msgs/s | Processing latency | Send latency |
|---|---|---|---|---|---|---|
| 1 | 1 | 2 | 1 725,00 | 1 725,00 | 105,00 | 48,00 |
| 5 | 1 | 2 | 3 976,00 | 3 995,00 | 142,00 | 48,00 |
| 25 | 1 | 2 | 10 642,00 | 10 657,00 | 145,00 | 48,00 |
| 1 | 2 | 4 | 1 870,00 | 1 870,00 | 138,00 | 48,00 |
| 5 | 2 | 4 | 5 958,00 | 5 957,00 | 143,00 | 48,00 |
| 25 | 2 | 4 | 18 023,00 | 18 026,00 | 145,00 | 48,00 |
| 1 | 4 | 8 | 3 379,00 | 3 377,00 | 143,00 | 48,00 |
| 5 | 4 | 8 | 10 014,00 | 10 015,00 | 145,00 | 48,00 |
| 25 | 4 | 8 | 24 834,00 | 24 828,00 | 146,00 | 48,00 |
| 25 | 6 | 12 | 27 392,00 | 27 388,00 | 147,00 | 75,00 |
| 25 | 8 | 16 | 26 699,00 | 26 696,00 | 148,00 | 95,00 |
Redis Streams
| Version | 6.2.4, jedis client 3.6.1 |
| Replication | active-passive |
| Replication type | asynchronous |
Redis is probably best known as a really fast and useful key-value cache/database. It might be less known that Redis supports both persistence and replication, as well as fail-over and sharding using cluster.
However, Redis also offers a streaming component. The logical design borrows some concepts from Kafka (such as consumer groups), however, the internal implementation is entirely different. The documentation includes a comprehensive tutorial, providing usage guidelines and detailing the design along with its limitations.
Using streams with Redis is implemented using the XADD, XRANGE, XREAD, XREADGROUP and XACK commands. In addition to the basic operation of adding an element to a stream, it offers three basic modes of accessing data:
- range scans to read an arbitrary stream element or elements
- fan-out reads where every consumer reads every message (topic semantics)
- consumer group reads where every consumer reads a dedicated set of messages (queue semantics)
We'll be using the consumer group functionality. Each consumer group and each consumer within a group is identified by a unique identifier. To receive a message, a consumer needs to issue the XREADGROUP command with the stream name, consumer group id, and consumer id. When a message is processed, it needs to be acknowledged using XACK.
For each stream and consumer group, Redis maintains server-side state which determines which consumer received which messages, which messages are not yet received by any consumer, and which have been acknowledged. What's important is that consumer ids have to be managed by the application. This means that if a consumer with a given id goes offline permanently, it's possible that some messages will get stuck in a received, but not acknowledged state. To remedy the situation, other consumers should periodically issue a XAUTOCLAIM command, which reassigns messages, if they haven't been processed for the given amount of time. This is a mechanism similar to SQS's visibility timeouts, however, initiated by the client, not the server.
Moreover, after a consumer restarts, it should first check if there are some unacknowledged messages which are assigned to its id. If so, they should be reprocessed. Combined with auto-claiming, we get an implementation of at-least-once delivery. Unlike in Kafka or other messaging systems, the clients need to take care and implement this correctly to make sure no messages are lost.
Replication in Redis is asynchronous, unless we use the WAIT command after each operation to make sure it's propagated across the cluster. We won't be using this option in our tests, as it goes against the way Redis should be used and even the documentation states that it will make the system very slow. Hence, upon failure, some data loss is possible. Note that it is recommended to have persistence enabled when using replication, as otherwise it's possible to have the entire state truncated upon a node restart.
Persistence, by default, flushes data to disk asynchronously (every second) but this can be configured to flush after each command - however, again, causing a huge performance penalty.
Additional features of Redis Streams include message delivery counters (allowing implementing a dead letter queue), observability commands and specifying a maximum number of elements in a stream, truncating the stream if that limit is exceeded. What's worth noting is a dedicated section in the documentation, explicitly stating the features and limitations of the persistence & replication system, clearly stating when data loss might occur. This leaves no doubt when choosing the right tradeoffs in a system's design.
Finally, let's focus on scaling Redis Streams. All of the streaming operations above operate on a single Redis key, residing on a single Redis master server (operations are then replicated to slaves). What if we'd like to scale our system above that? One solution is to use Redis Cluster and multiple stream keys. When sending data, we then have to choose a stream key, either randomly or in some deterministic fashion. This resembles Kafka's partitions and partition keys. On the consumer side, we might consume from all keys at once; we could also have dedicated consumers for keys, but then we'd need some way to maintain a cluster-wide view of the consumer <-> key association, to ensure that each key is consumed by some consumer, which isn't an easy task. The number of keys also needs to be large enough to ensure that they are evenly distributed across the shards (distribution is based on key hash values).
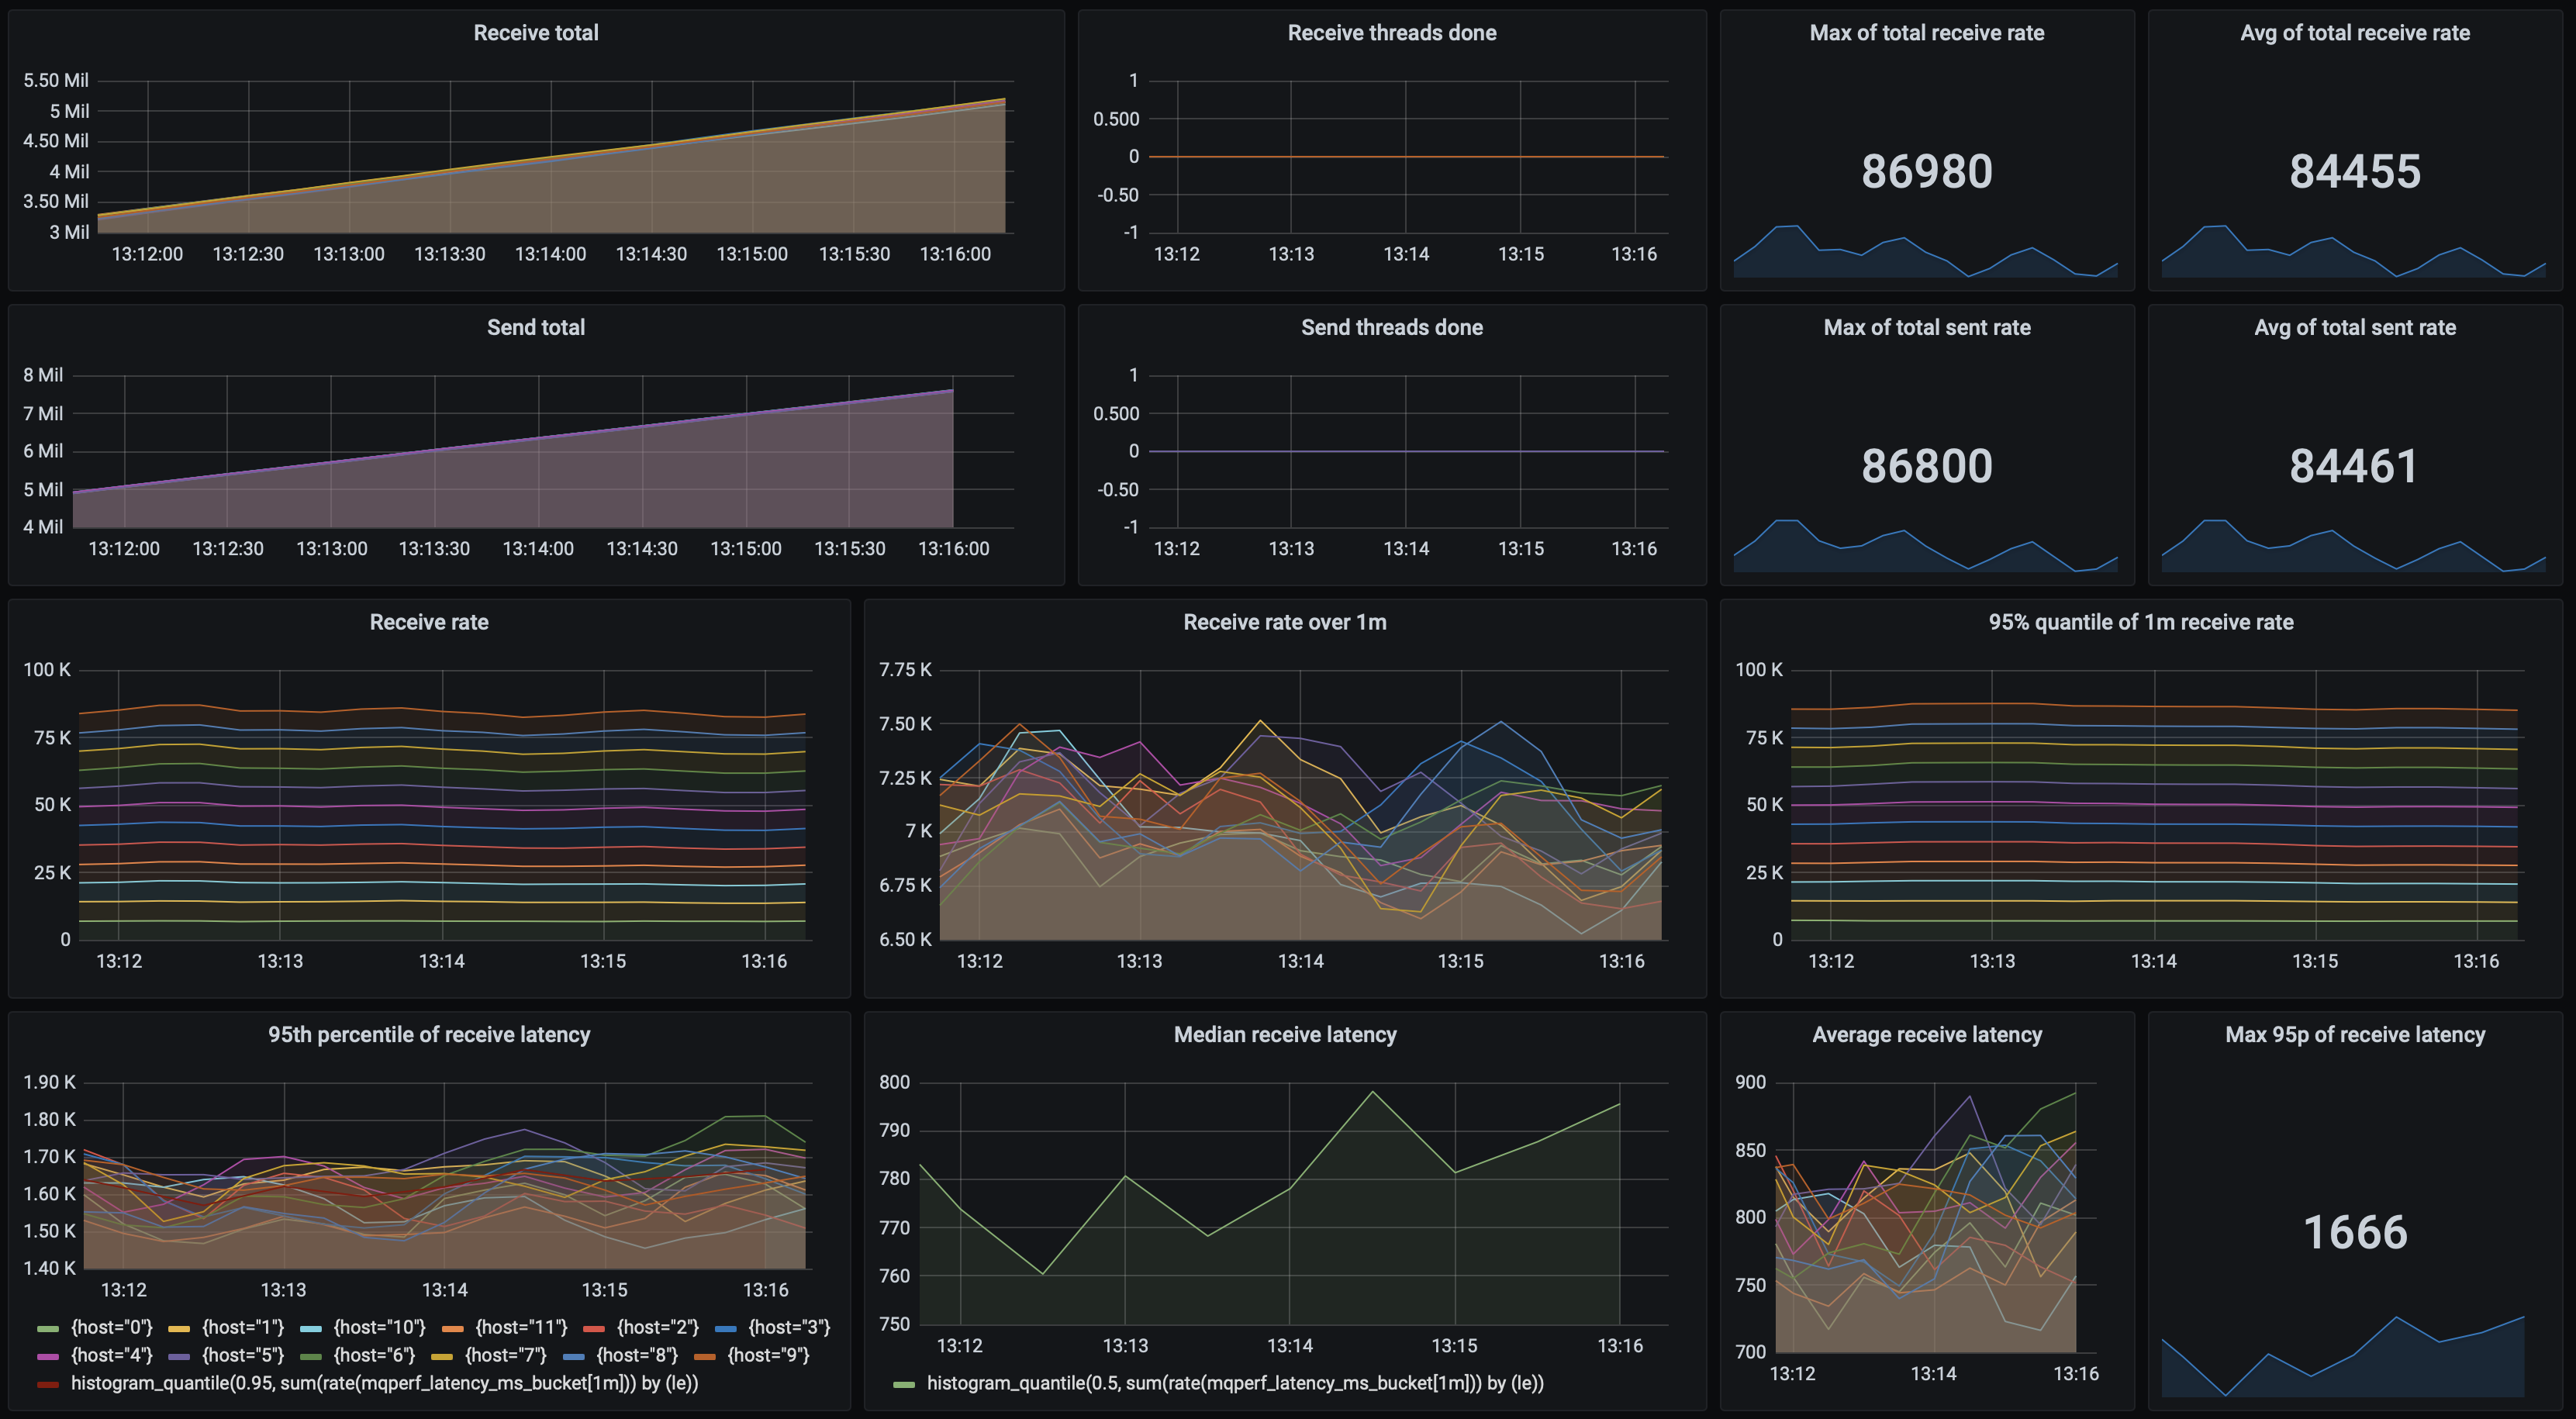
Let's look at the performance test results. A 3-node active-passive setup achieved up to 41 600 msgs/s:
However, when we employ a sharded cluster of 9 nodes, that is 3x(master + 2 replicas), and with 100 stream keys, we can get up to 84 000 msgs/s, however with quite high latencies:
Here are the test results in full:
| Threads | Sender nodes | Receiver nodes | Send msgs/s | Receive msgs/s | Processing latency | Send latency |
|---|---|---|---|---|---|---|
| 1 | 2 | 4 | 20 114 | 20 116 | 45 | 45 |
| 10 | 2 | 4 | 32 879 | 32 878 | 47 | 47 |
| 10 | 6 | 6 | 39 792 | 38 796 | 48 | 48 |
| 10/15 | 8 | 12 | 39 744 | 39 743 | 48 | 48 |
| 20/15 | 8 | 12 | 39 387 | 39 391 | 48 | 48 |
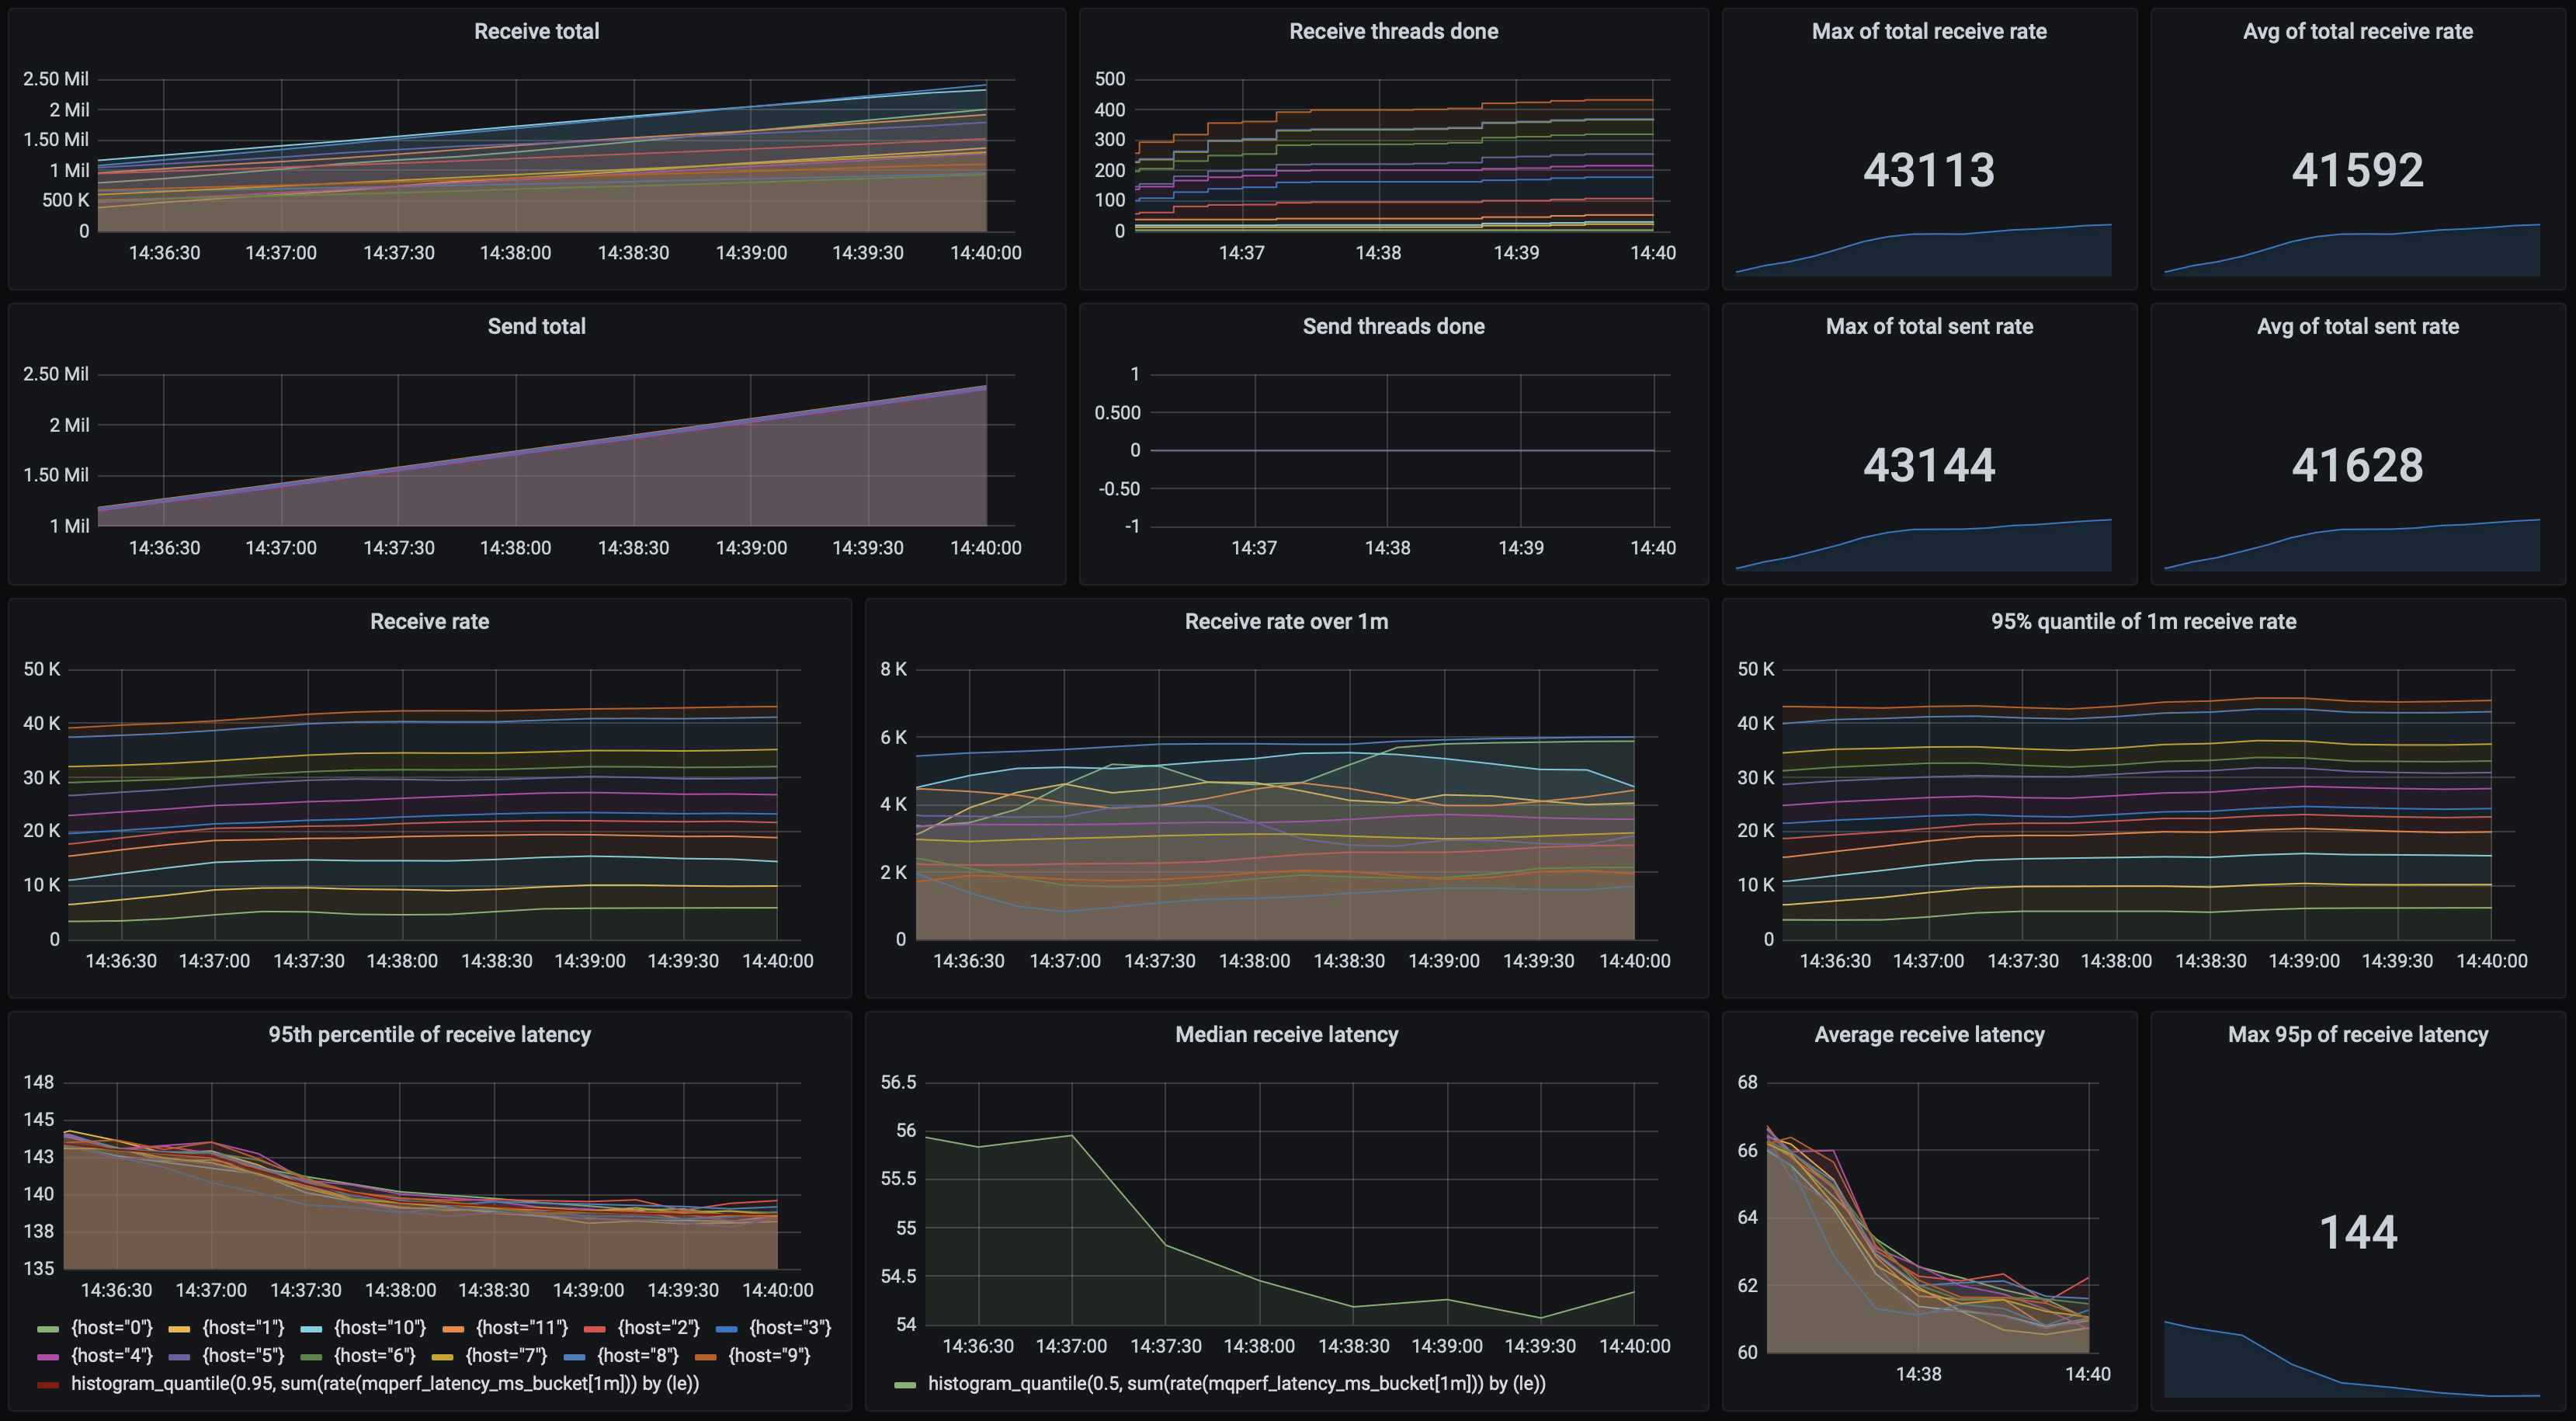
| 60/15 | 8 | 12 | 42 750 | 42 748 | 108 | 137 |
| 80/15 | 8 | 12 | 41 592 | 41 628 | 144 | 178 |
Pulsar
| Version | 2.6.2 |
| Replication | configurable, asynchronous & synchronous |
| Replication type | active-active |
Apache Pulsar is a distributed streaming and messaging platform. It is often positioned in a similar segment as Apache Kafka, and the two platforms are often compared and contrasted.
Pulsar was initially developed at Yahoo!, and now continues to evolve as an open-source project. It builds upon two other Apache projects:
- ZooKeeper for cluster discovery and coordination
- BookKeeper as the replicated storage service
A Pulsar deployment consists of nodes which take on one of three roles:
- bookie: handles persistent storage of messages
- broker: a stateless service which accepts messages from producers, dispatches messages to consumers and communicates with bookies to store data
- zookeeper: which provides coordination services for the above two
Hence, a minimal deployment should in fact consist of more than 3 nodes (although we can colocate a couple of roles on a single machine). For our tests we have decided to use separate machines for separate roles, and hence we ended up with 3 zookeeper nodes, 3 bookie nodes and 2 broker nodes.
When working with Pulsar, we’re dealing with three main concepts: messages, topics and subscriptions. Producers send messages to topics, either individually or in batches. Consumers can subscribe to a topic in four modes: exclusive, failover, shared and key_shared, providing a subscription name.
Combining a shared or unique subscription name, with one of the four consumption modes, we can achieve pub-sub topics, message queues, or a combination of these behaviours. Pulsar is very flexible in this regard.
Messages in Pulsar are deleted after they are acknowledged, and this is tracked per-subscription. That is, if there are no subscribers to a topic, messages will be marked for deletion right after being sent. Acknowledging a message in one subscription doesn’t affect other subscriptions. Additionally, we can specify a message retention policy, to keep messages for a longer time.
Moreover, topics can be partitioned. Behind the scenes, Pulsar creates an internal topic for every partition (these partitions are something quite different than in Kafka!). However, from the producers' and consumers' point of view such a topic behaves as a single one. As a single topic is always handled by a single broker, increasing the number of partitions, we can increase throughput by allowing multiple brokers to accept and dispatch messages.
As mentioned above, all storage is handled by Apache BookKeeper. Entries (messages) are stored in sequences called ledgers. We can configure how many copies of a ledger are created (managedLedgerDefaultEnsembleSize), in how many copies a message is stored (managedLedgerDefaultWriteQuorum) and how many nodes have to acknowledge a write (managedLedgerDefaultAckQuorum). Following our persistence requirements, we’ve been using 3 ledger copies, and requiring at least 2 copies of each message.
The setting above corresponds to synchronous replication, but by setting the quorum to 1 or 0, we would get an asynchronous one.
Unlike previously discussed queues, pulsar is an active-active system: that is, every node is equal and can handle user requests. Coordination is performed via Zookeeper, which also secures the cluster against split-brain problems.
Pulsar offers a number of additional features, such as Pulsar Functions, SQL, transactions, geo replication, multi-tenancy, connectors to many popular data processing systems (Pulsar IO), a schema registry and others.
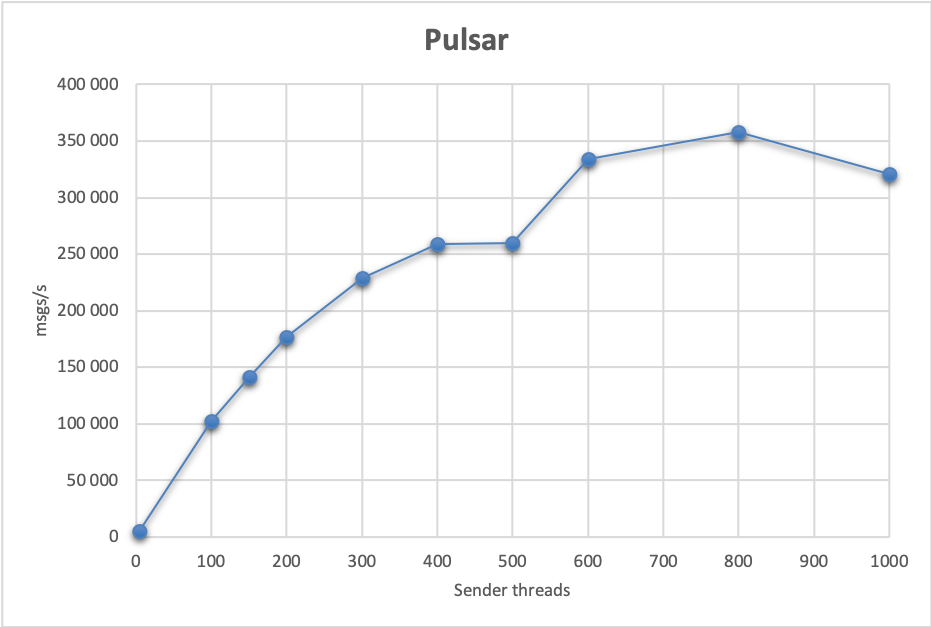
Performance-wise, it shows that each node can handle messaging traffic. A baseline setup using a single partition achieves 1 300 msgs/s. Using 8 sender and 16 receiver nodes, each running 25 threads, we get 147 000 msgs/s.
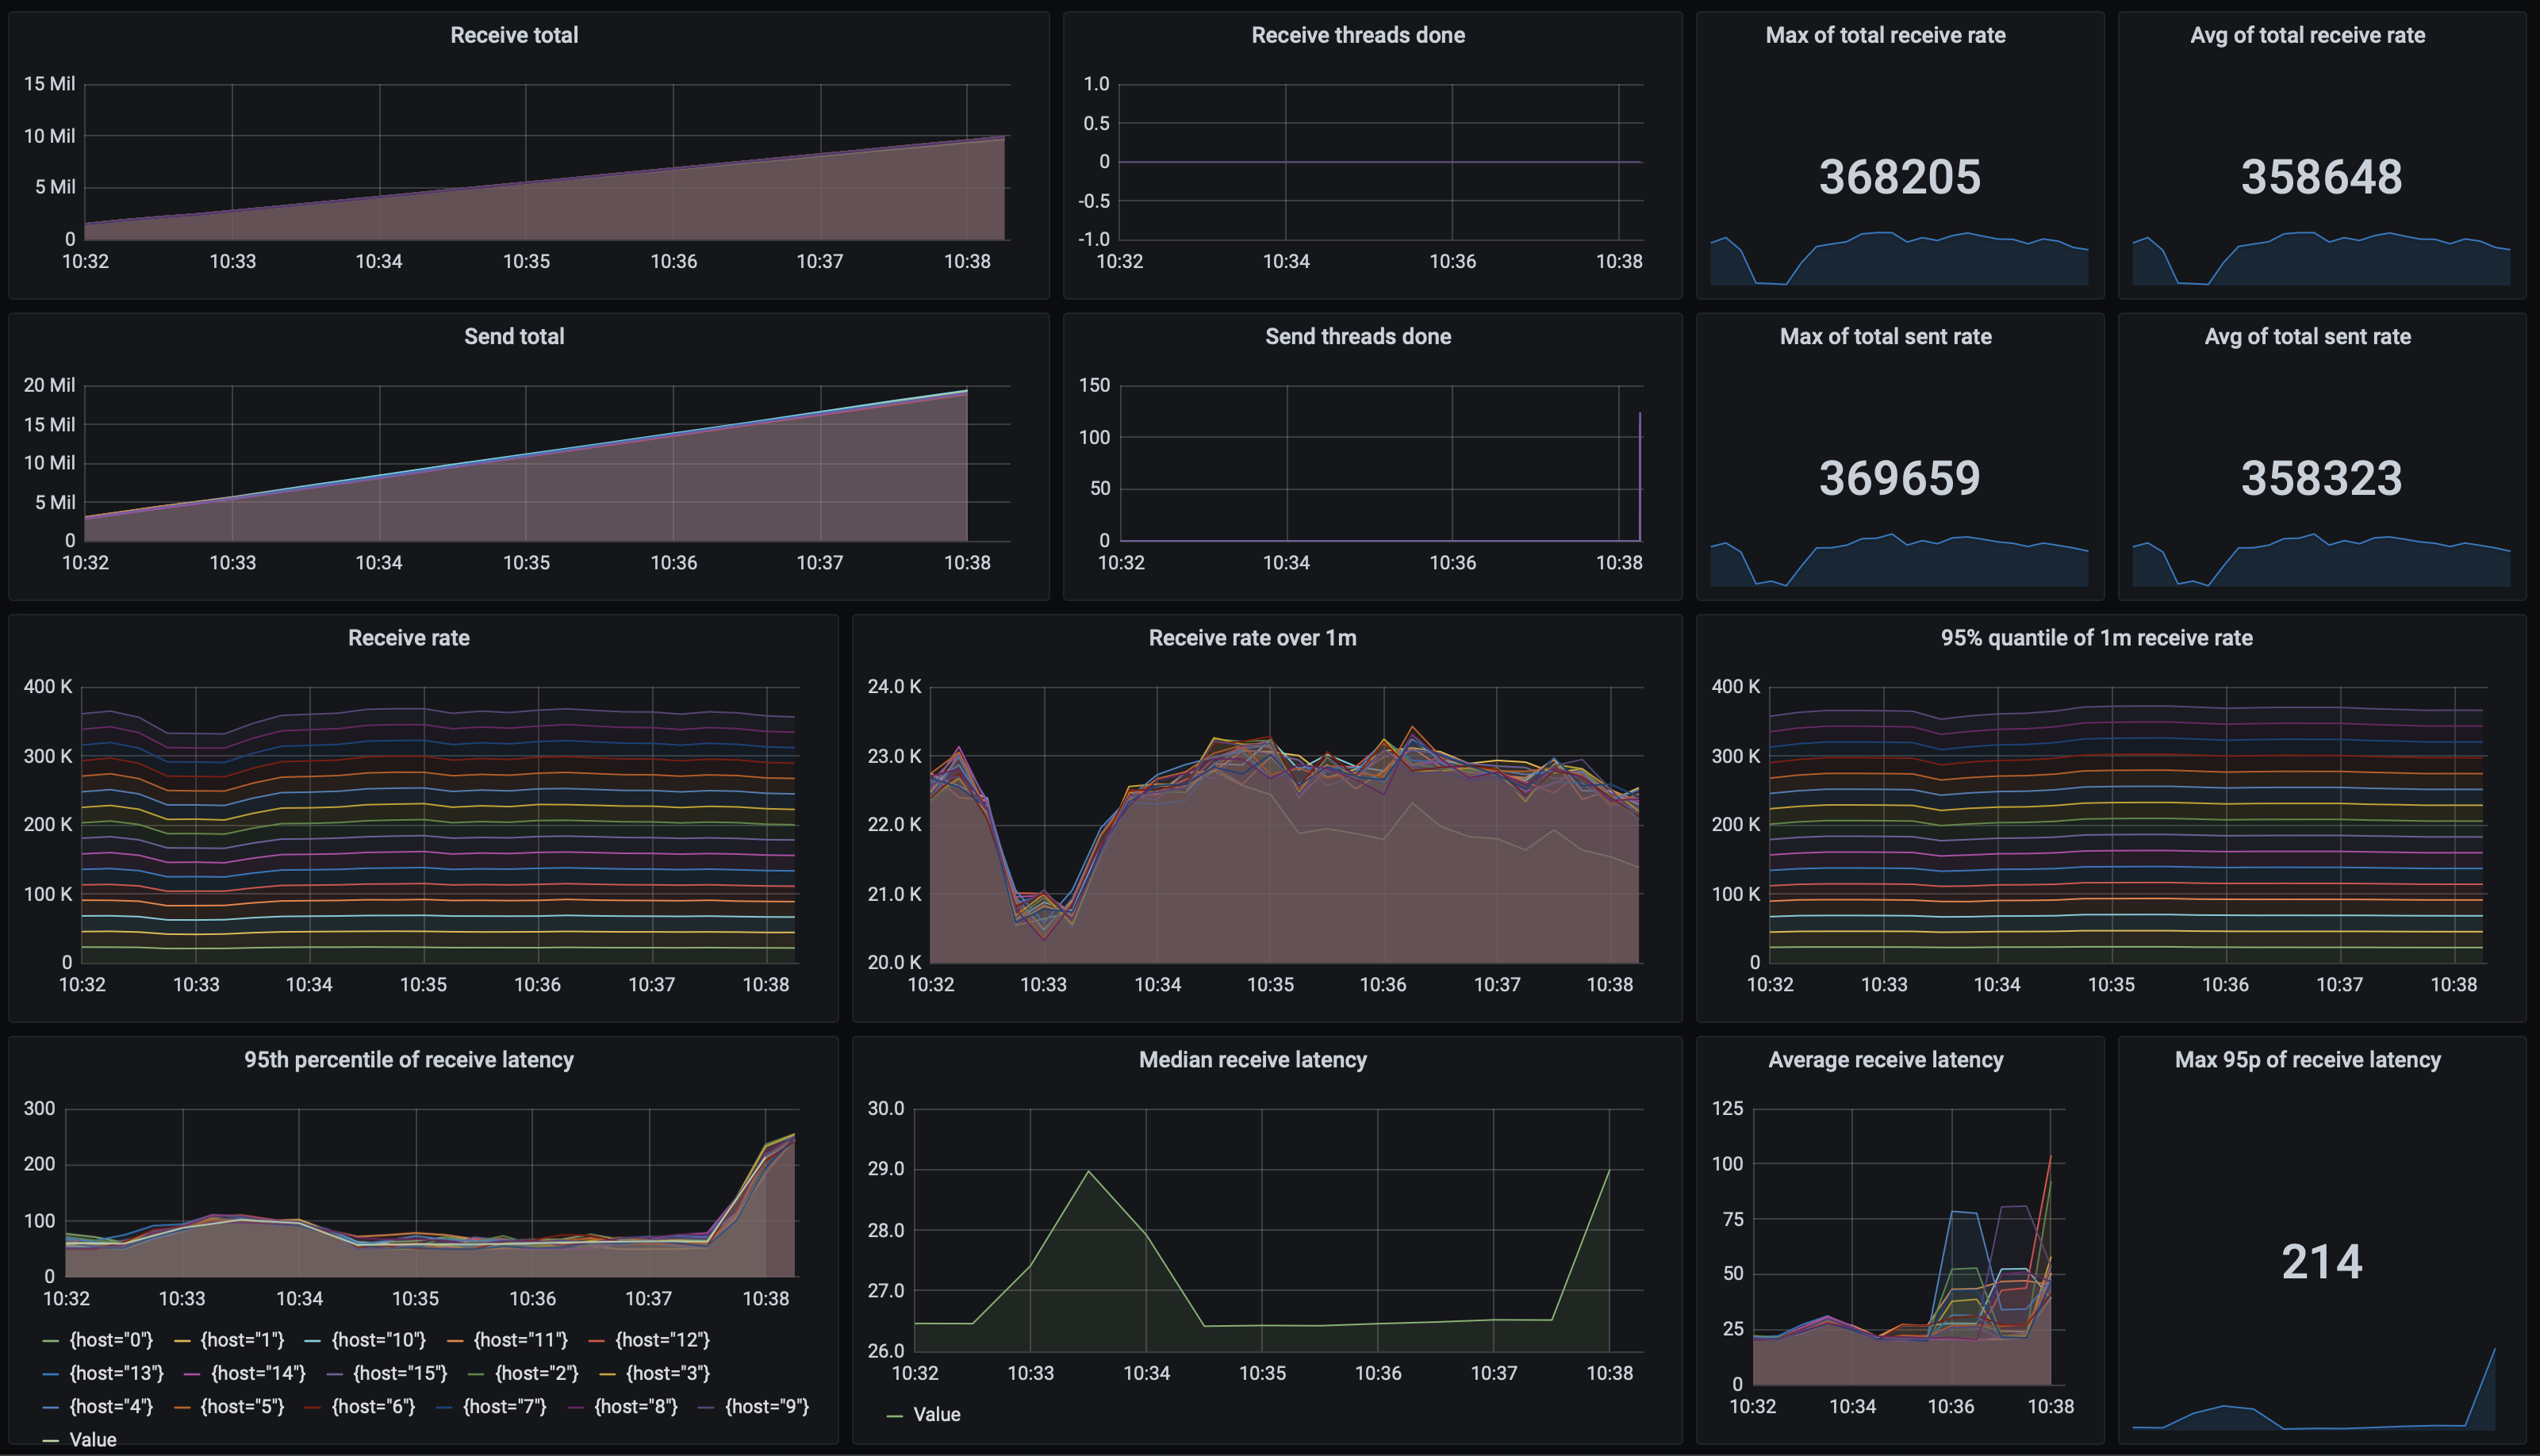
However, we can also increase the number of partitions, thus increasing concurrency. We achieved the best results using 4 partitions (that is, a single broker was handling 2 partitions on average); adding more partitions didn’t further increase performance. Here, we got up to 358 000 msgs/s using 8 sender nodes each running 100 threads, and 16 receiver nodes each running 25 threads.
Send latencies are stable, and the 95th percentile is 48 ms. Processing latencies vary from 48 ms, to at most 214 ms in the test which achieved highest throughput.
Here are the full test results, for 1 partition:
| Threads | Sender nodes | Receiver nodes | Send msgs/s | Receive msgs/s | Processing latency | Send latency |
|---|---|---|---|---|---|---|
| 1 | 1 | 2 | 1 298,00 | 1 298,00 | 48,00 | 48,00 |
| 5 | 1 | 2 | 6 711,00 | 6 711,00 | 112,00 | 48,00 |
| 25 | 1 | 2 | 31 497,00 | 31 527,00 | 48,00 | 48,00 |
| 1 | 2 | 4 | 2 652,00 | 2 652,00 | 48,00 | 48,00 |
| 5 | 2 | 4 | 12 787,00 | 12 789,00 | 107,00 | 48,00 |
| 25 | 2 | 4 | 55 621,00 | 55 677,00 | 50,00 | 48,00 |
| 1 | 4 | 8 | 5 156,00 | 5 156,00 | 72,00 | 48,00 |
| 5 | 4 | 8 | 24 048,00 | 24 054,00 | 94,00 | 48,00 |
| 25 | 4 | 8 | 96 154,00 | 96 272,00 | 50,00 | 48,00 |
| 25 | 6 | 12 | 124 152,00 | 124 273,00 | 50,00 | 48,00 |
| 50 | 6 | 12 | 160 237,00 | 160 254,00 | 102,00 | 48,00 |
| 25 | 8 | 16 | 147 348,00 | 147 405,00 | 50,00 | 48,00 |
And using 4 partitions:
| Threads | Sender nodes | Receiver nodes | Send msgs/s | Receive msgs/s | Processing latency | Send latency |
|---|---|---|---|---|---|---|
| 1 | 4 | 8 | 5 248,00 | 5 237,00 | 61,00 | 48,00 |
| 25 | 4 | 8 | 102 821,00 | 102 965,00 | 50,00 | 48,00 |
| 25 | 6 | 12 | 141 462,00 | 141 977,00 | 50,00 | 48,00 |
| 50 | 6 | 12 | 228 875,00 | 228 958,00 | 73,00 | 48,00 |
| 25 | 8 | 16 | 176 439,00 | 176 388,00 | 50,00 | 48,00 |
| 50 | 8 | 16 | 259 133,00 | 259 203,00 | 64,00 | 48,00 |
| 75/25 | 8 | 16 | 333 622,00 | 333 643,00 | 65,00 | 48,00 |
| 100/25 | 8 | 16 | 358 323,00 | 358 648,00 | 214,00 | 49,00 |
| 50 | 10 | 20 | 260 070,00 | 260 165,00 | 94,00 | 48,00 |
| 100/25 | 10 | 16 | 320 853,00 | 320 315,00 | 2 698,00 | 49,00 |
RocketMQ
| Version | 4.7.1 |
| Replication | configurable, asynchronous & synchronous |
| Replication type | active-passive |
RocketMQ is a unified messaging engine and lightweight data processing platform. The message broker was initially created as a replacement for ActiveMQ 5 (not the Artemis version we discussed before, but its predecessor). It aims to support similar use-cases, provides JMS and native interfaces (among others), and puts a focus on performance.
There are three node types from which a RocketMQ cluster is created:
- broker master, which accepts client connections, receives and sends messages
- broker slave, which replicates data from the master
- name server, which provides service discovery and routing
Each broker cluster can work in synchronous or asynchronous replication modes, which is configured on the broker level. In our tests, we’ve been using synchronous replication.
In theory, it should be possible to deploy a broker cluster with a single master and two slaves, to achieve a replication factor of 3. However, we couldn’t get this setup to work. Hence instead, we’ve settled on a similar configuration as with ActiveMQ Artemis - three copies of master-slave pairs. Like with Artemis, a queue can be deployed on multiple brokers, and the messages are sharded/load-balanced when producing and consuming from the topic.
Additionally, we’ve deployed a single name server, but in production deployments, this component should be clustered as well, with a minimum of three nodes.
Speaking of topics, RocketMQ supports both pub-sub topics, as well as typical message queues, where each message is consumed by a single consumer. This corresponds to BROADCAST and CLUSTERING message consumption modes. Moreover, messages can be consumed in-order, or concurrently (we’ve been using the latter option).
Messages are consumed and acknowledged per consumer-group, which is specified when configuring the consumer. When creating a new consumer group, historical messages can be received, as long as they are still available; by default, RocketMQ retains messages for 2 days.
RocketMQ supports transactions, however there’s no built-in deduplication. Moreover, the documentation is quite basic, making this system a bit challenging to setup and understand. There’s no mention if and which consensus algorithm is used, and if split-brain scenarios are in any way addressed; however, there is a recommendation to deploy at least 3 name servers, which would hint at a quorum-based approach.
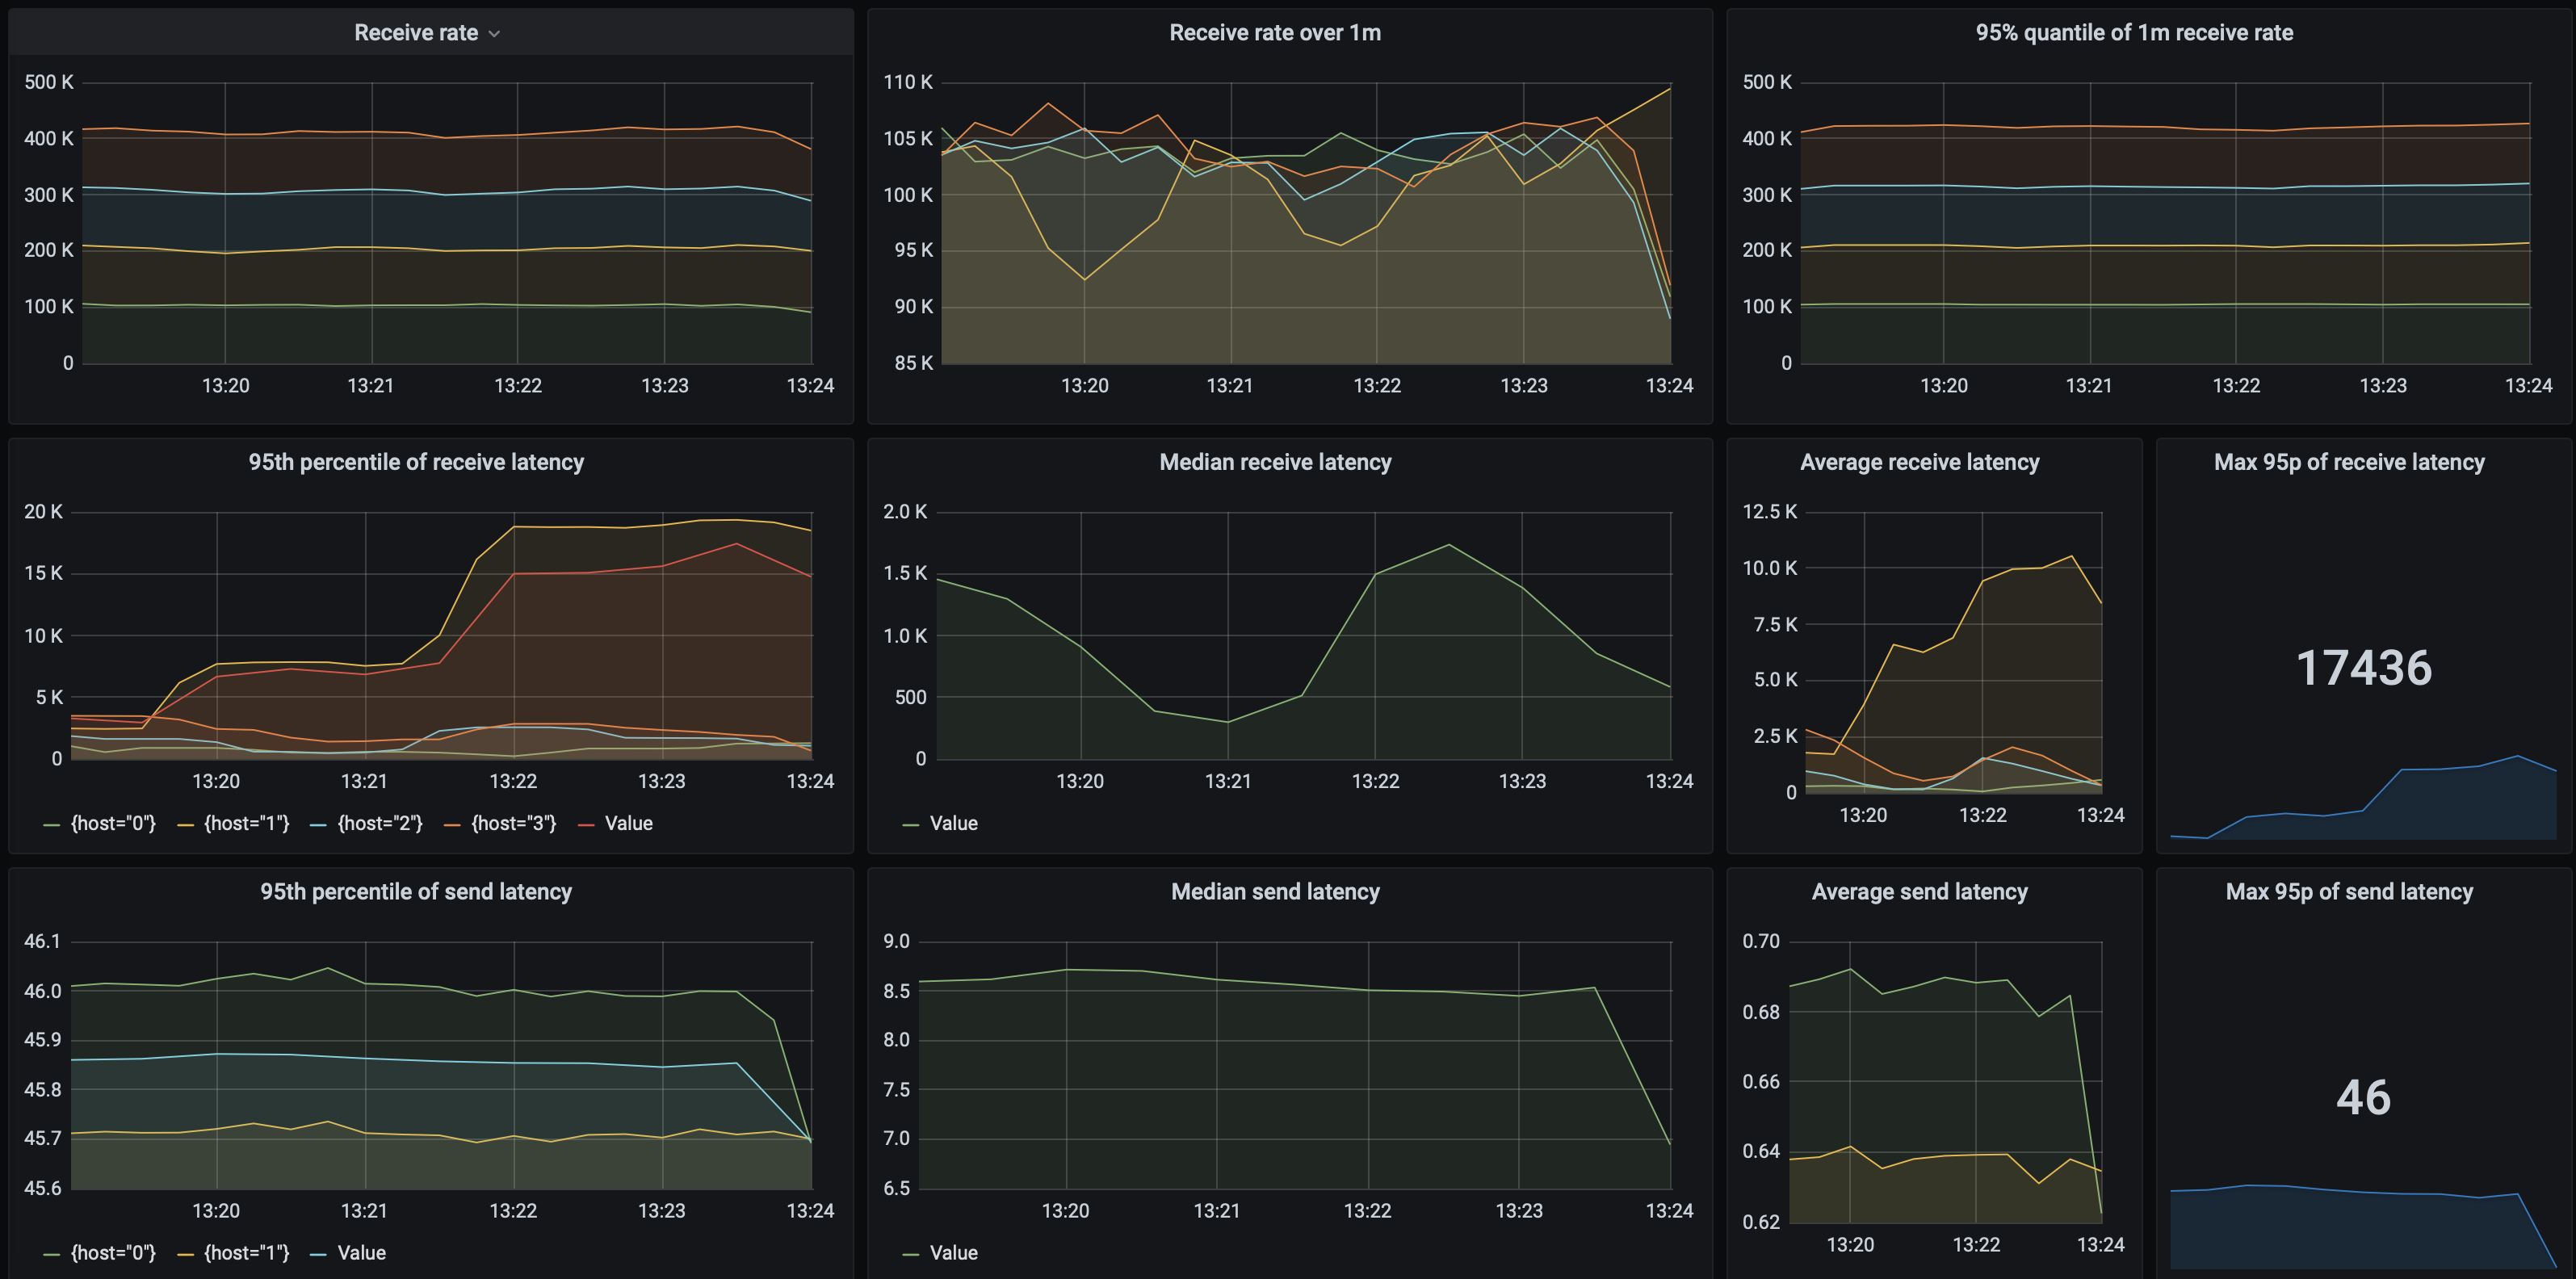
However, RocketMQ definitely makes up for these deficiencies in performance. Our baseline test with a single sender and 1 thread achieved 13 600 msgs/s. However, processing latency was quite large in that particular test - 37 seconds. It’s quite easy to overwhelm RocketMQ with sends so that the receiver threads can’t keep up. The most we’ve been able to achieve where sends are receives are on par is with 4 sender nodes, 4 receiver nodes running 25 threads each. In that case, the broker processed 485 000 msgs/s.
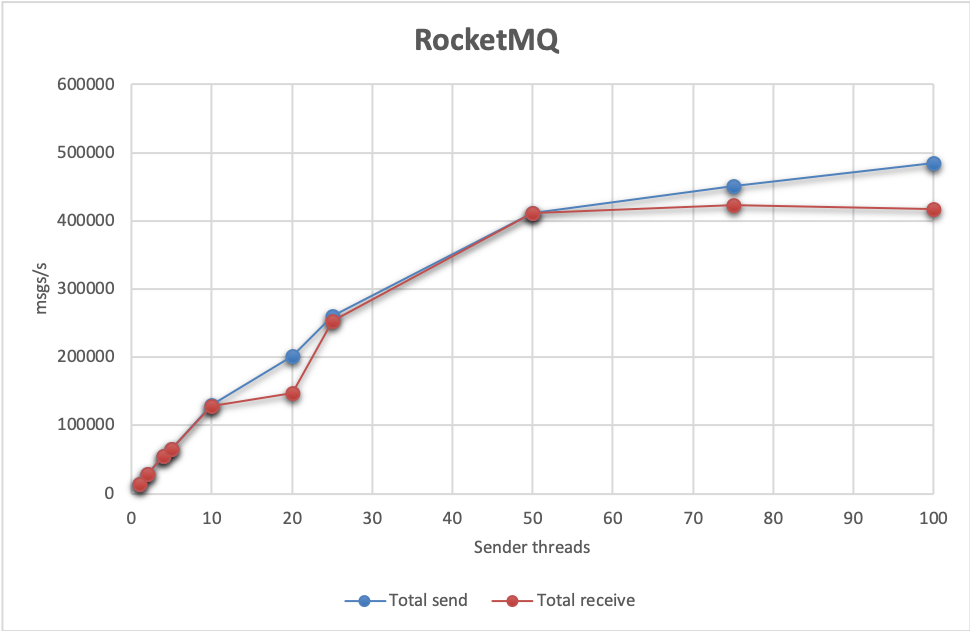
Send latencies are always within 44-47ms, however as mentioned, processing latencies get high pretty quickly. The highest throughput with reasonable processing latencies (162 ms) achieved 129 100 msgs/s.
Here’s a summary of our tests:
| Threads | Sender nodes | Receiver nodes | Send msgs/s | Receive msgs/s | Processing latency | Send latency |
|---|---|---|---|---|---|---|
| 1 | 1 | 2 | 13 605,00 | 14 183,00 | 37 056,00 | 44,00 |
| 5 | 1 | 2 | 64 638,00 | 64 635,00 | 94,00 | 44,00 |
| 25 | 1 | 2 | 260 093,00 | 252 308,00 | 18 859,00 | 45,00 |
| 1 | 2 | 4 | 29 076,00 | 29 075,00 | 135,00 | 43,00 |
| 5 | 2 | 4 | 129 106,00 | 129 097,00 | 162,00 | 44,00 |
| 25 | 2 | 4 | 411 923,00 | 410 891,00 | 17 436,00 | 46,00 |
| 25 | 3 | 6 | 451 454,00 | 422 619,00 | 60 000,00 | 46,00 |
| 1 | 4 | 8 | 55 662,00 | 55 667,00 | 960,00 | 44,00 |
| 5 | 4 | 8 | 202 110,00 | 147 859,00 | 60 000,00 | 45,00 |
| 25 | 4 | 4 | 485 322,00 | 416 900,00 | 60 000,00 | 47,00 |
Kafka
| Version | 2.6.0 |
| Replication | configurable, asynchronous & synchronous |
| Replication type | active-active |
Kafka is a distributed event-streaming platform. It is widely deployed and has gained considerable popularity in recent years. Originally developed at LinkedIn, it is now an open-source project, with commercial extensions and support offered by Confluent.
A Kafka cluster consists of a number of broker nodes, which handle persistence, replication, client connections: they both accept and send messages. In addition, there’s a ZooKeeper cluster which is used for service discovery and coordination. However, there are plans to replace that component with one built directly into the Kafka broker.
Kafka takes a different approach to messaging, compared to what we’ve seen before. The server itself is a streaming publish-subscribe system, or at an even more basic level, a distributed log. Each Kafka topic can have multiple partitions; by using more partitions, the consumers of the messages (and the throughput) may be scaled and concurrency of processing increased. It’s not uncommon for a topic to have 10s or 100s of partitions.
On top of the publish-subscribe system, which persists messages within partitions, point-to-point messaging (queueing) is built, by putting a significant amount of logic into the consumers. This again contrasts Kafka when comparing with other messaging systems we've looked at: there, usually it was the server that contained most of the message-consumed-by-one-consumer logic. Here it's the consumer.
Each consumer in a consumer group reads messages from a number of dedicated partitions; hence it doesn't make sense to have more consumer threads than partitions. Or in other words, a single partition is consumed by exactly one consumer within a consumer group (as long as there are any consumers).
Messages aren't acknowledged on the server (which is a very important design difference!), but instead processed message offsets are managed by consumers and written per-parition back to a special Kafka store (or a client-specific store), either automatically in the background, or manually. This allows Kafka to achieve much better performance.
Such a design has a couple of consequences:
- only messages from each partition are processed in-order. A custom partition-routing strategy can be defined
- all consumers should consume messages at the same speed. Messages from a slow consumer won't be "taken over" by a fast consumer
- messages are acknowledged "up to" an offset. That is messages can't be selectively acknowledged.
- no "advanced" messaging options are available, such as routing or delaying message delivery.
You can read more about the design of the consumer in Kafka's docs, which are quite comprehensive and provide a good starting point when setting up the broker.
It is also possible to add a layer on top of Kafka to implement individual message acknowledgments and re-delivery, see our article on the performance of kmq and the KMQ project. This scheme uses an additional topic to track message acknowledgements. In case a message isn’t acknowledged within specified time, it is re-delivered. This is quite similar to how SQS works. When testing Kafka, we’ve primarily tested “vanilla” Kafka, but also included a KMQ test for comparison.
To achieve guaranteed sends and at-least-once delivery, we used the following configuration (see the KafkaMq class):
- topic is created with a
replication-factorof3 - for the sender, the
request.required.acksoption is set to-1(synchronous replication; in conjunction withmin.insync.replicastopic config set to2a send request blocks until it is accepted by at least 2 replicas - a quorum when we have 3 nodes in total). If you'd like asynchronous replication, this can be set to1(a send request blocks until it is accepted by the partition leader) - consumer offsets are committed every 10 seconds manually; during that time, message receiving is blocked (a read-write lock is used to assure that). That way we can achieve at-least-once delivery (only committing when messages have been "observed").
It’s important to get the above configuration right. You can read more about proper no-data-loss Kafka configuration on our blog, as well as how to guarantee message ordering: by default, even within a partition, messages might be reordered!
As Kafka uses ZooKeeper, network partitions are handled at that level. Kafka has a number of features which are useful when designing a messaging or data streaming system, such as deduplication, transactions, a SQL interface, connectors to multiple popular data processing systems, a schema registry and a streaming framework with in-Kafka exactly-once processing guarantees.
Let’s look at the performance tests. Here, Kafka has no equals, the numbers are impressive. A baseline test achieved around 7 000 msgs/s. Using 8 sender nodes and 16 receiver nodes, running 25 threads each, we can achieve 270 000 msgs/s.
However, we didn’t stop here. It turns out that the sending part is the bottleneck (and it might not be surprising, as that’s where most coordination happens: we wait for messages to be persisted and acknowledged; while on the receiver side, we allow asynchronous, periodic offset commits). By using 200 threads on 16 sender nodes, with 16 receiver nodes, but running only 5 threads each, we achieved 828 000 msgs/s.
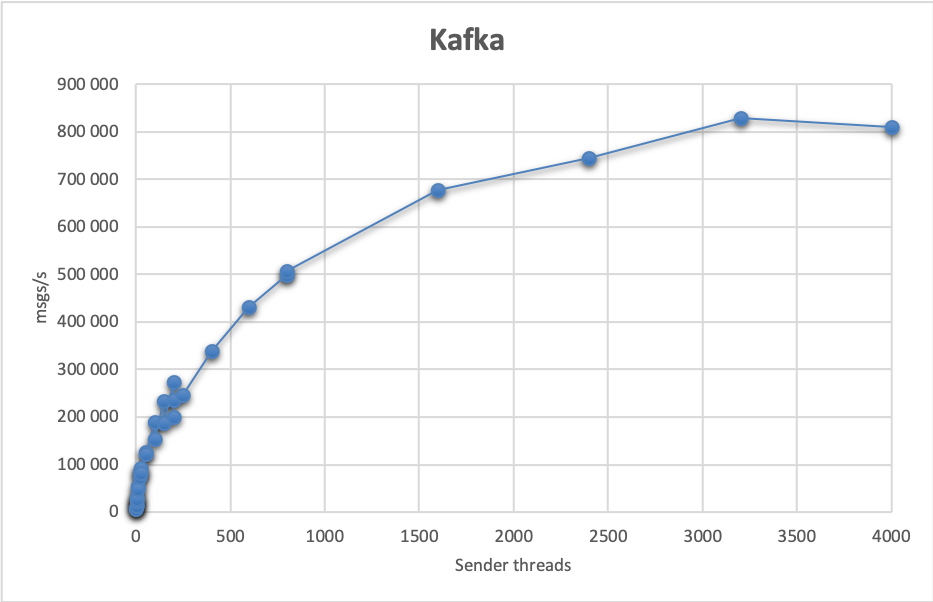
We’ve been using at least 64 partitions for the tests, scaling this up if there were more total receiver threads, to 80 or 100 partitions.
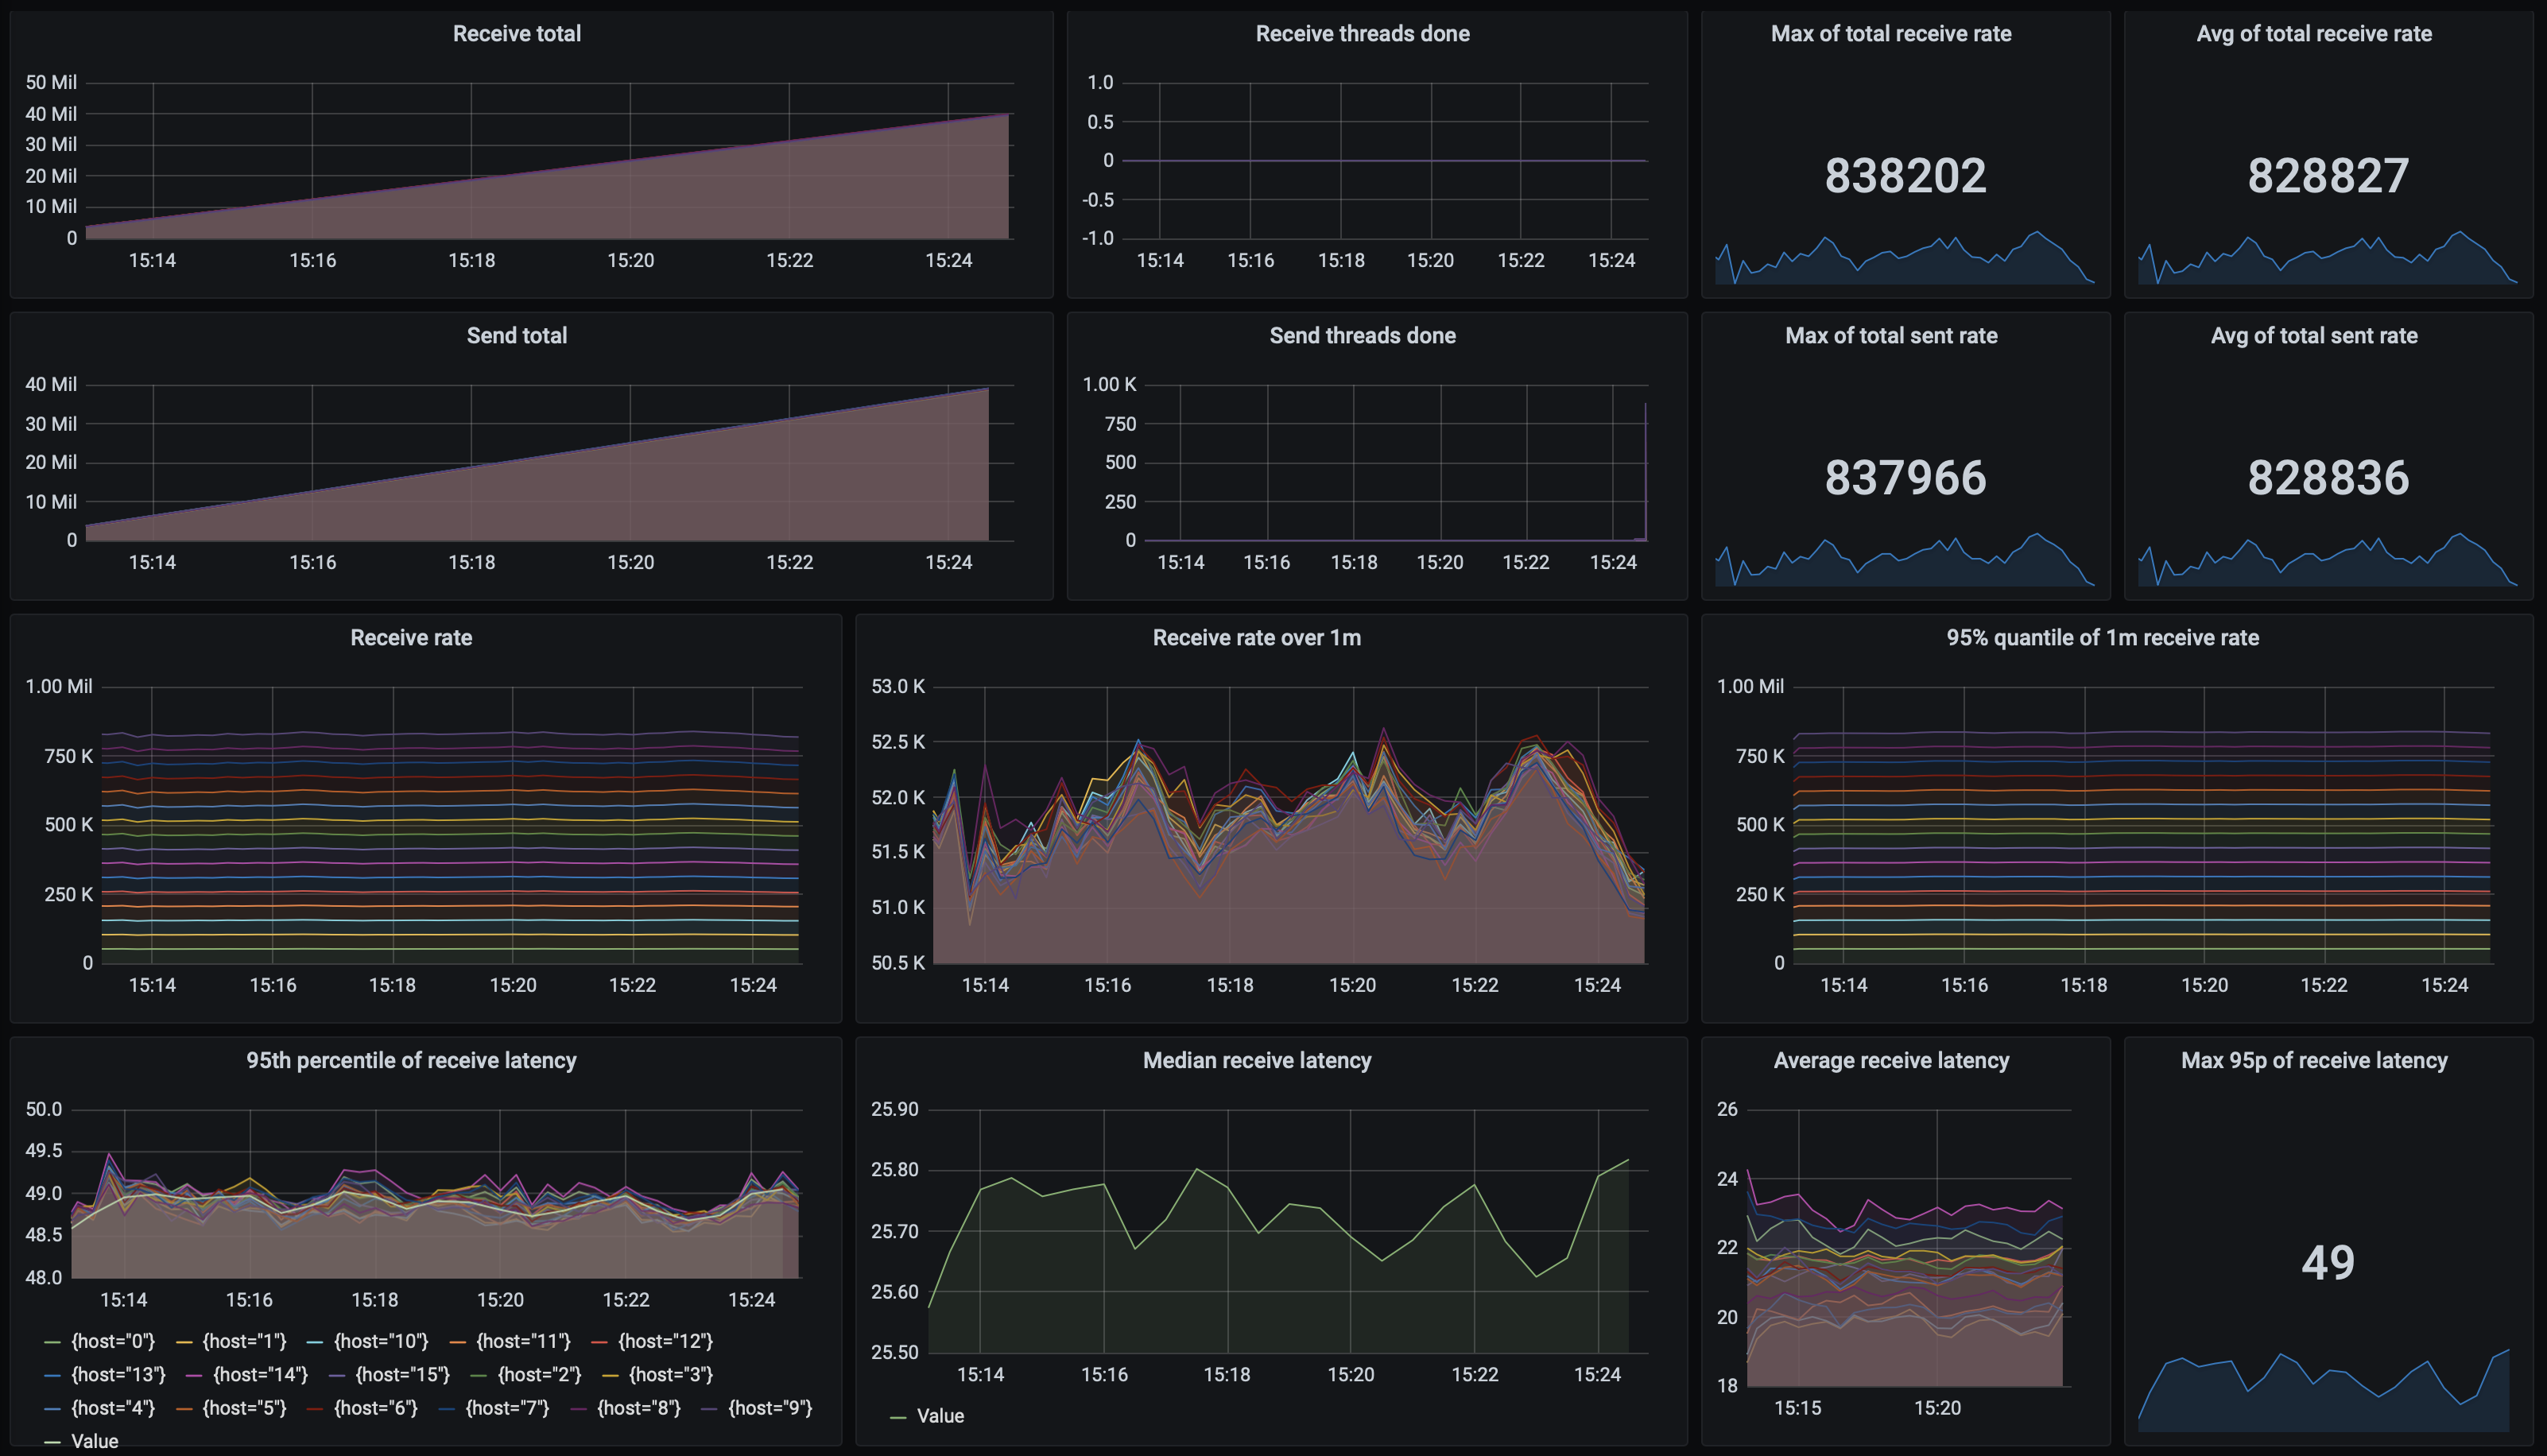
What about latencies? They are very stable, even under high load. 95th percentile of both send and receives latencies is steadily at 48 ms. Here’s the dashboard from the test run with the biggest throughput:
As mentioned before, we’ve also tested a setup with selective message acknowledgments, using KMQ (the implementation is here). Adding another topic for tracking redeliveries, and performing additional message marker sends did impact performance, but not that much. Using 100 threads on 20 senders, and 5 threads on 16 senders, we’ve achieved a throughput of 676 800 msgs/s. However, processing latencies went up to about 1 812 ms:
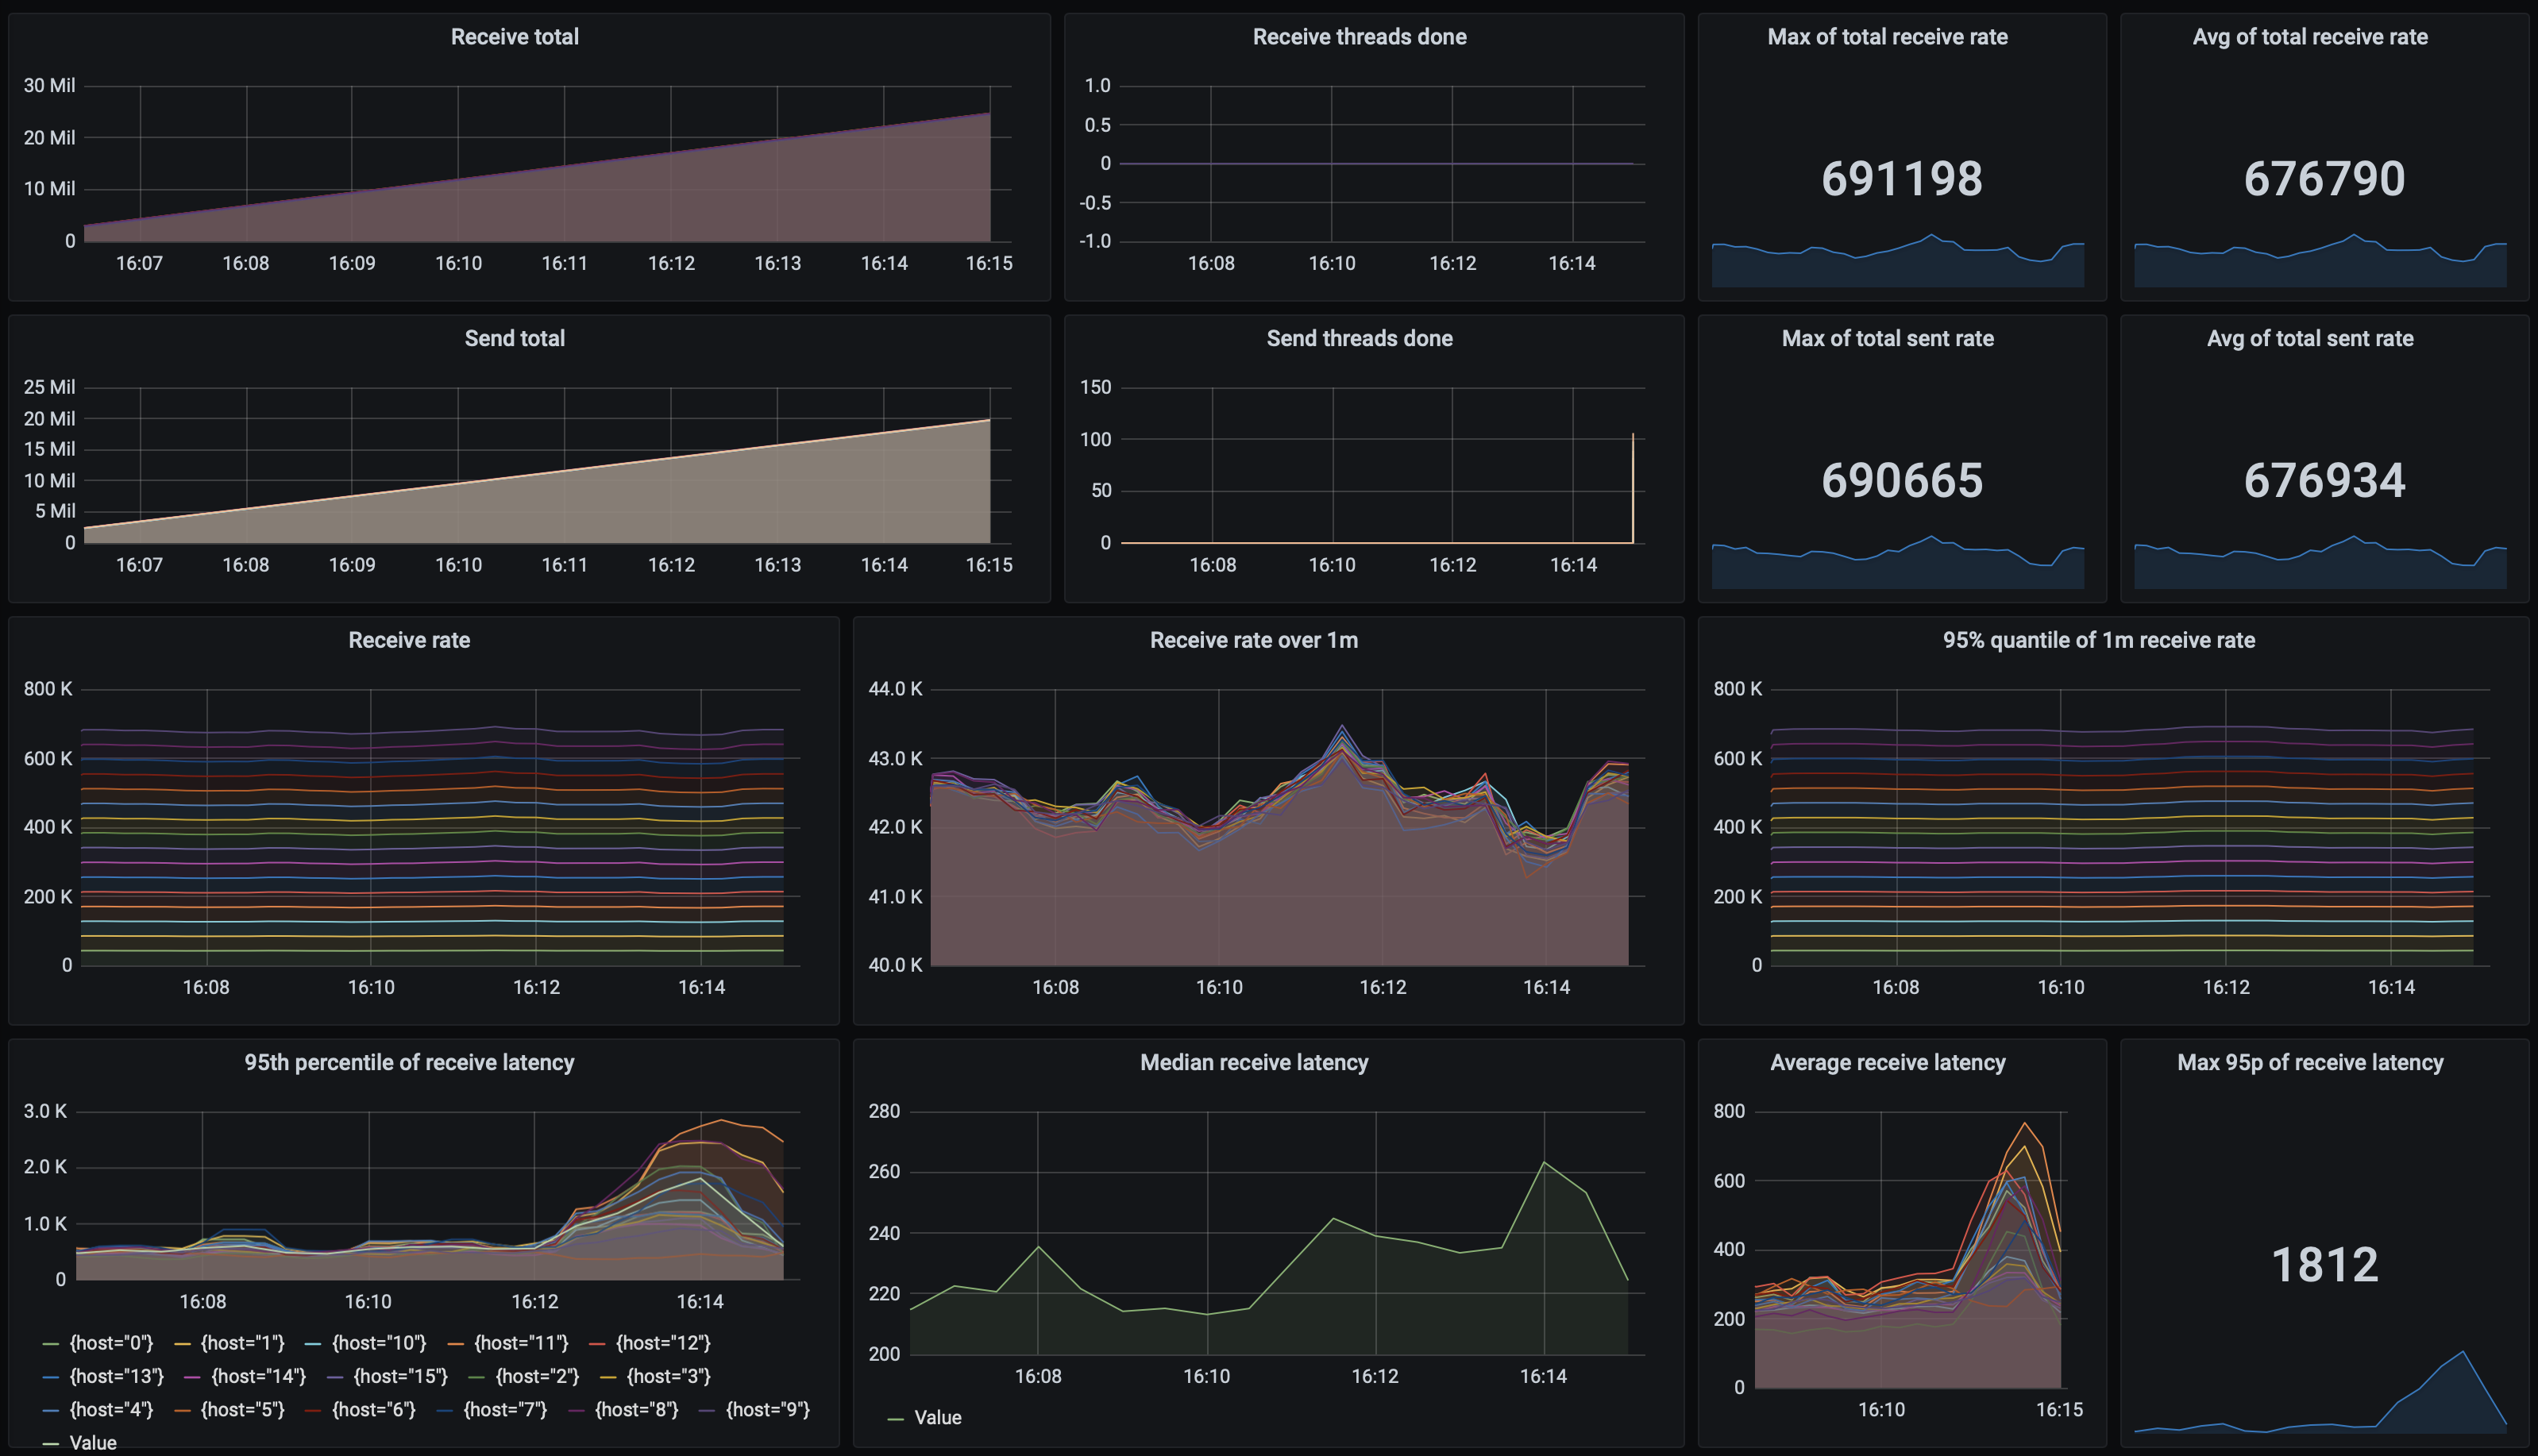
Finally, here are our Kafka test results in full:
| Threads | Sender nodes | Receiver nodes | Send msgs/s | Receive msgs/s | Processing latency | Send latency |
|---|---|---|---|---|---|---|
| 1 | 1 | 2 | 7 458,00 | 7 463,00 | 47,00 | 47,00 |
| 5 | 1 | 2 | 31 350,00 | 31 361,00 | 47,00 | 47,00 |
| 25 | 1 | 2 | 92 373,00 | 92 331,00 | 81,00 | 47,00 |
| 1 | 2 | 4 | 15 184,00 | 15 175,00 | 47,00 | 47,00 |
| 5 | 2 | 4 | 55 402,00 | 55 355,00 | 47,00 | 47,00 |
| 25 | 2 | 4 | 127 274,00 | 127 345,00 | 50,00 | 48,00 |
| 1 | 4 | 8 | 27 044,00 | 27 045,00 | 47,00 | 47,00 |
| 5 | 4 | 8 | 84 234,00 | 84 223,00 | 48,00 | 47,00 |
| 25 | 4 | 8 | 188 557,00 | 188 524,00 | 48,00 | 48,00 |
| 25 | 6 | 12 | 233 379,00 | 233 228,00 | 48,00 | 48,00 |
| 25 | 8 | 16 | 272 828,00 | 272 705,00 | 48,00 | 48,00 |
| 25/5 | 8 | 16 | 235 782,00 | 235 802,00 | 48,00 | 48,00 |
| 50/5 | 8 | 16 | 338 591,00 | 338 614,00 | 48,00 | 48,00 |
| 75/5 | 8 | 16 | 432 049,00 | 432 071,00 | 48,00 | 48,00 |
| 100/5 | 8 | 16 | 498 528,00 | 498 498,00 | 48,00 | 48,00 |
| 25/5 | 10 | 20 | 245 284,00 | 245 304,00 | 48,00 | 48,00 |
| 50/5 | 16 | 16 | 507 393,00 | 507 475,00 | 48,00 | 48,00 |
| 100/5 | 16 | 16 | 678 255,00 | 678 279,00 | 48,00 | 48,00 |
| 150/5 | 16 | 16 | 745 203,00 | 745 163,00 | 49,00 | 49,00 |
| 200/5 | 16 | 16 | 828 836,00 | 828 827,00 | 49,00 | 49,00 |
| 200/5 | 20 | 16 | 810 555,00 | 810 553,00 | 77,00 | 77,00 |
RedPanda
| Version | 21.7.4 |
| Replication | configurable, asynchronous & synchronous |
| Replication type | active-active |
The RedPanda system targets mission-critical workloads and exposes a Kafka-compatible API. Hence, the way messaging works in RedPanda carries over from Kafka - we've got topics, partitions, consumer groups, etc. In fact, we're using exactly the same client code to test both RedPanda and Kafka. However, the devil lies in the details!
Let's start with data safety. RedPanda's motto, "Zero data loss" indicates its focus on mission-critical systems. By default, RedPanda's configuration for a 3-node cluster corresponds to the following Kafka properties:
acks=-1min.insync.replicas=2(quorum)log.flush.interval.messages=1
The last one is especially interesting as that's where RedPanda differs from what you'd often use in a synchronously-replicated Kafka setup, and also from what we've used in our tests. In Kafka, setting log.flush.interval.messages to 1 ensures that the disk cache is flushed on every message, and that's what happens in RedPanda as well. In other words, once a message is accepted by the quorum, it is guaranteed that it will be persistently stored on disk (the default in Kafka, and in our tests, is an unbounded number of messages, hence disk flushes happen asynchronously). This approach to disk safety is similar to what we've seen in RabbitMQ. Keep this in mind while reading the results.
On the inside, RedPanda uses a mixture of C++ and Go, while Kafka is JVM-based. Moreover, one of the main selling points of RedPanda is that it eliminates the dependency on ZooKeeper. Instead, it uses the Raft consensus protocol. This has very practical consequences: RedPanda will accept a write once a majority of nodes (the quorum) accepts it; Kafka, on the other hand, will wait for a confirmation from all in-sync-replicas, which might take a longer time (if the ISR set is larger than the quorum). This also means that any disturbance in the cluster will have larger implications on latencies in Kafka, than in RedPanda. It's worth noting that Kafka goes in the same direction with its KRaft implementation.
RedPanda comes with other interesting features, such as an auto-tuner, which detects the optimal settings given the hardware it's running on. Or the Wasm transformations supports: think of it as an in-process Kafka streams stage. Another interesting aspect is that RedPanda exposes Prometheus metrics natively.
Let's take a look at the performance results. Our test environment goes against RedPanda's guidelines not to use networked block devices (we're using EBS's gp2 drives), however we wanted to keep the test environment the same for all queues.
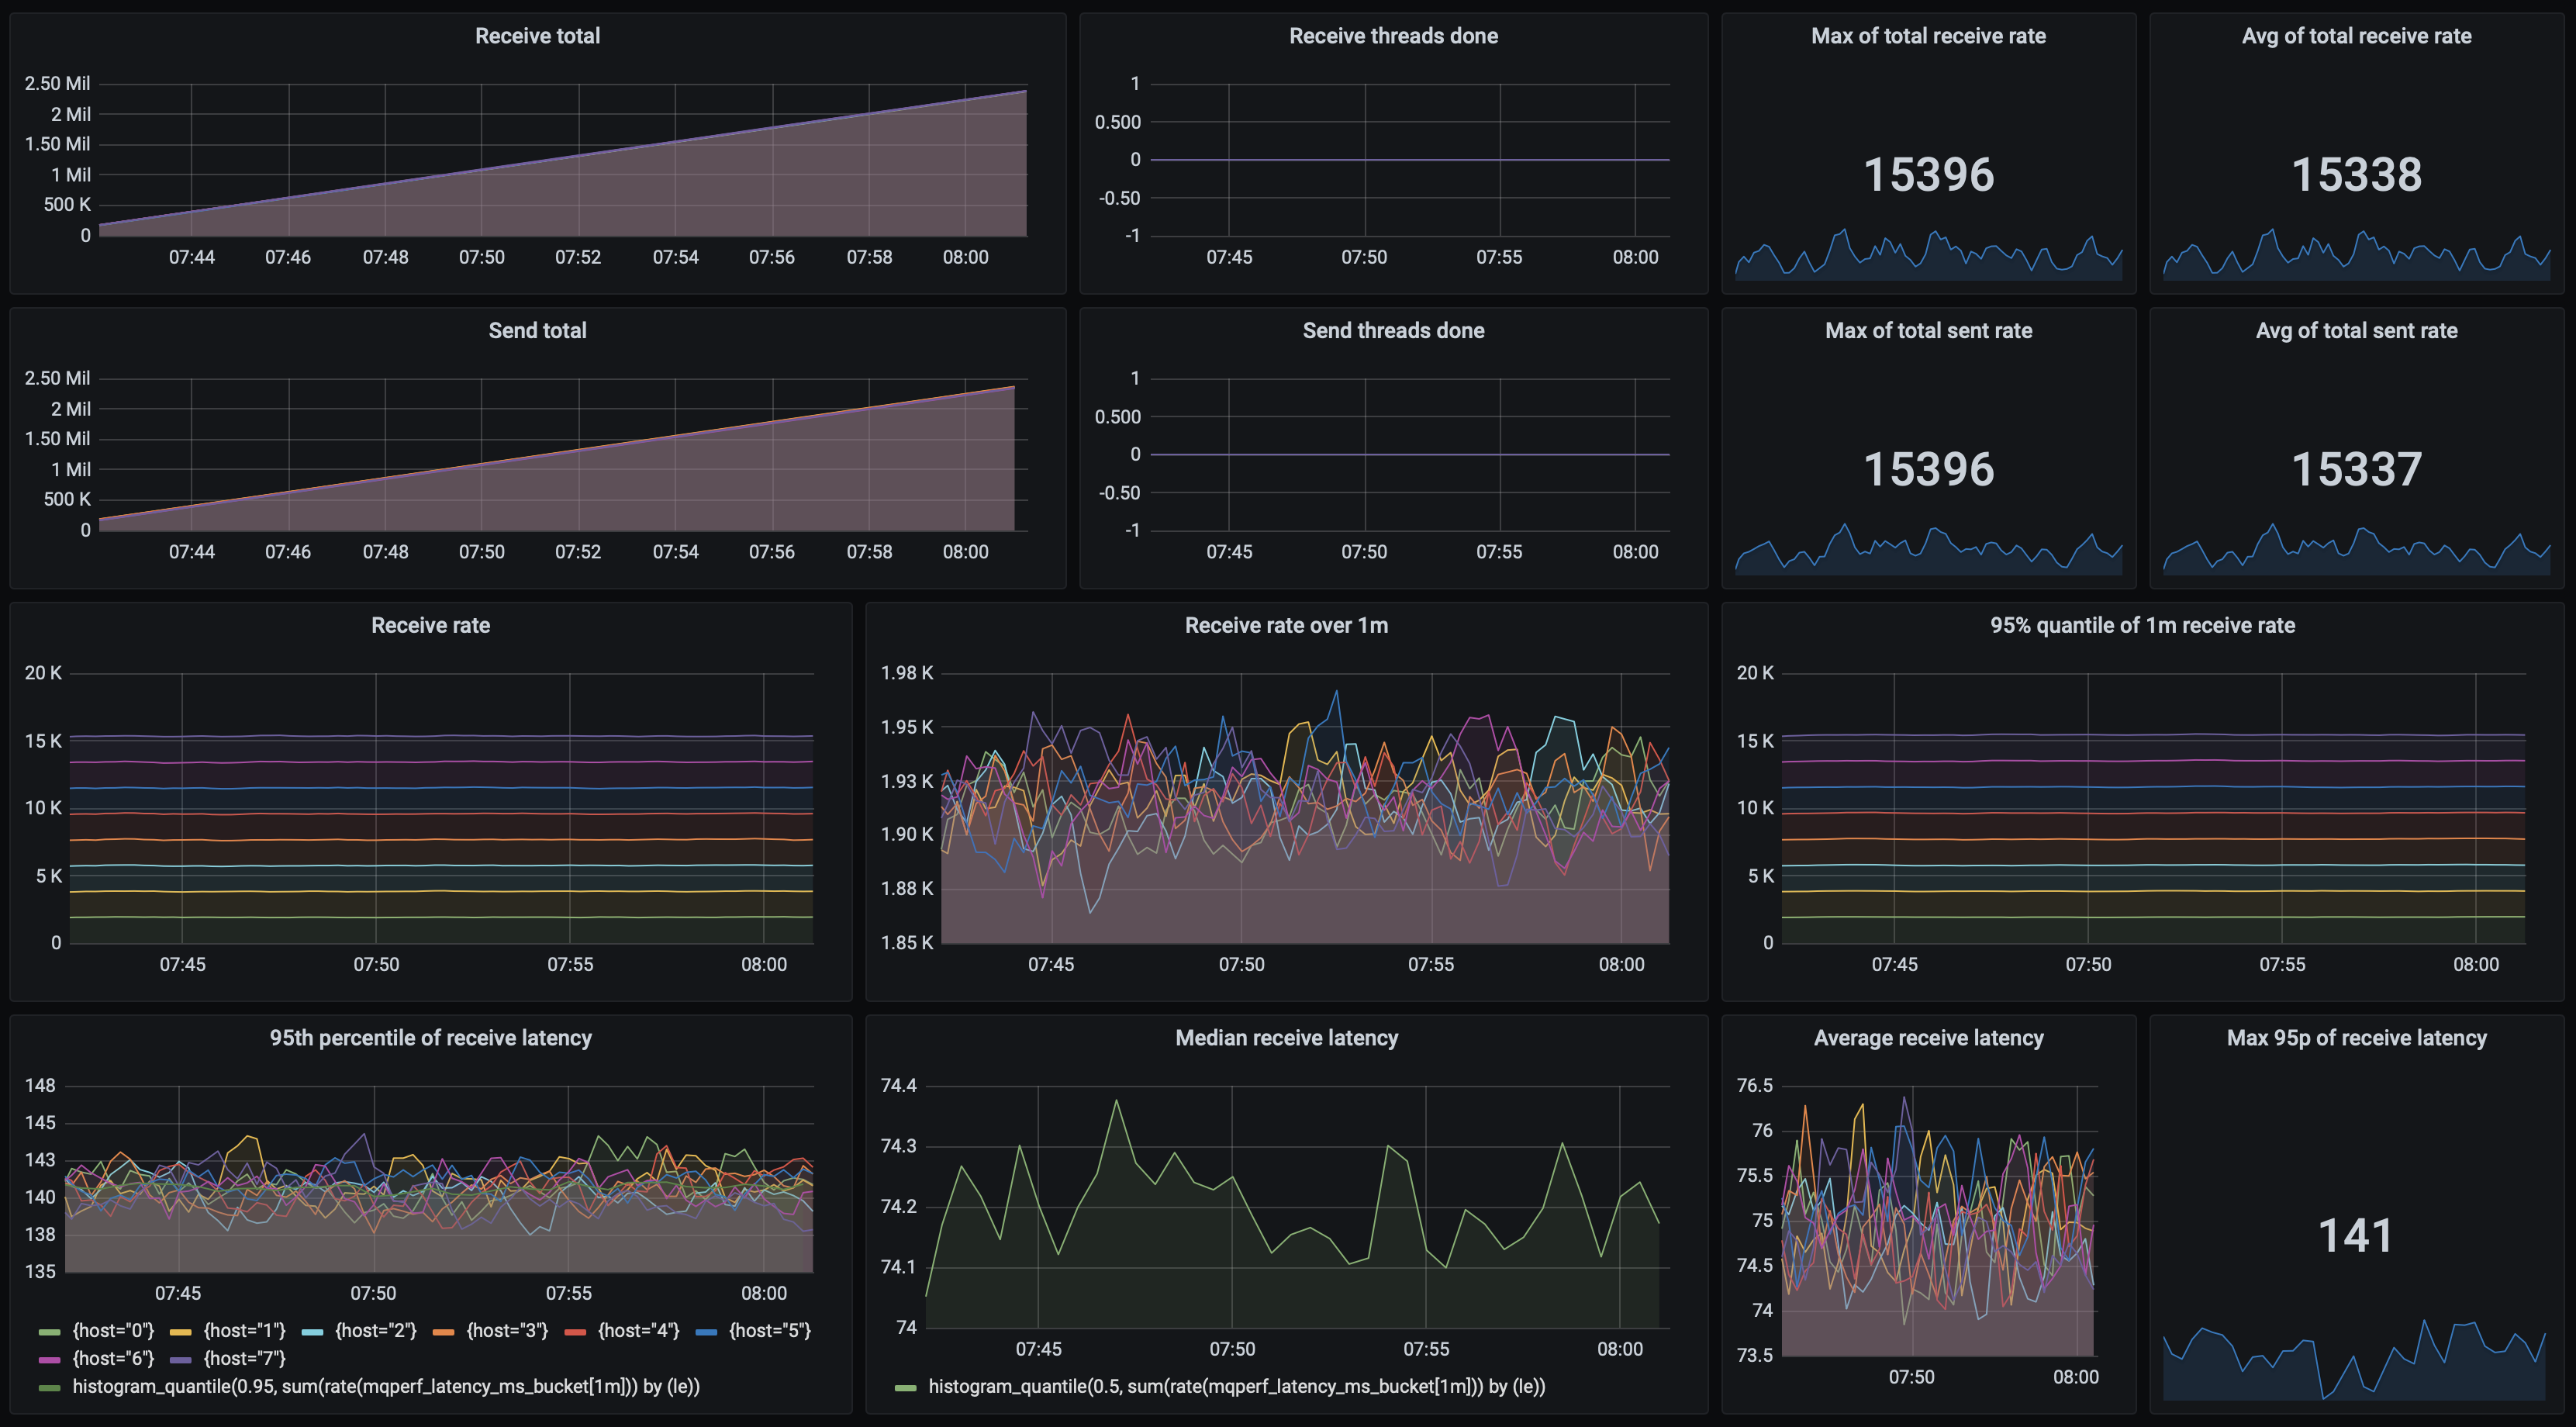
RedPanda achieved up to about 15 300 msgs/s using 200 partitions, 8 sender nodes, 8 receiver nodes each running 25 threads:
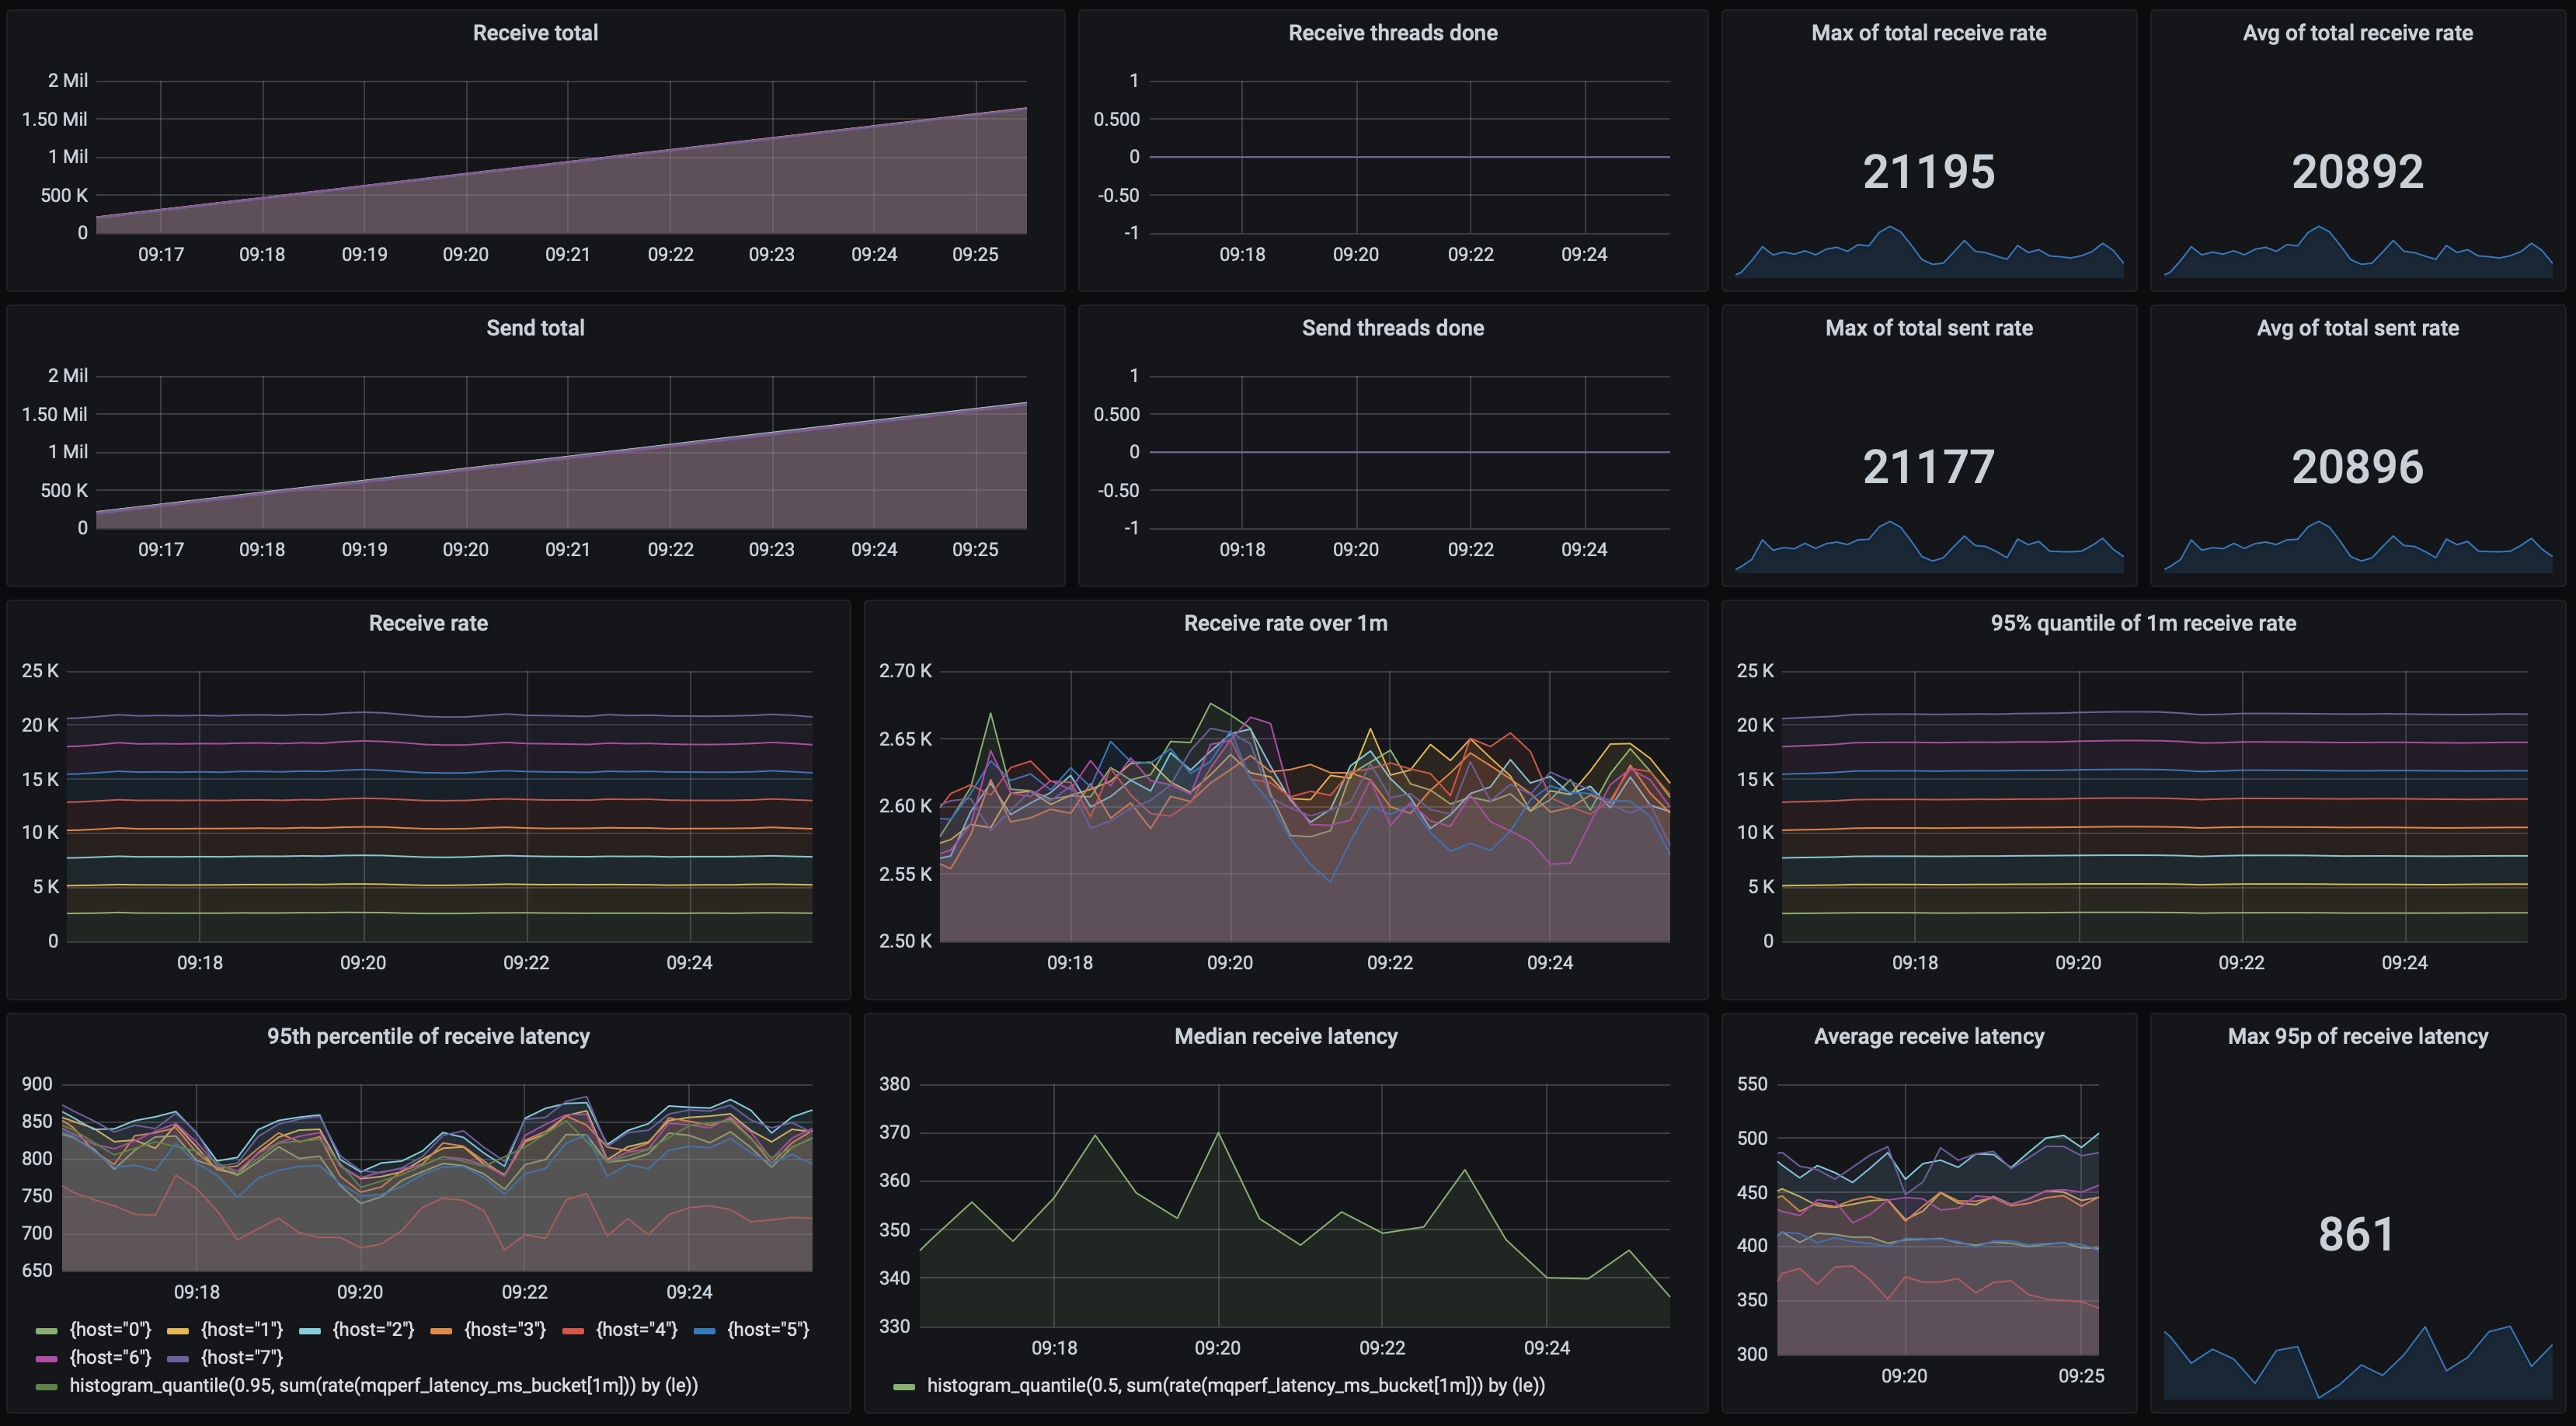
Again, that's quite similar to what RabbitMQ achieves. Maybe that's the limit of queues which fsync each received message (or in our test scenario - a batch of up to 10 messages)? How does Kafka behave when we set log.flush.interval.messages=1? Turns out, it's a bit faster. We've managed to get to 20 800 msgs/s using 64 partitions, 8 sender nodes (running 200 threads each) and 8 receiver nodes (running 5 threads each). However, the latencies went up to about 800ms:
Finally, here are RedPanda's test results in full. Similarly to Kafka, both send and processing latencies oscillate around 47ms, though they do get slightly higher as we increase the number of senders to get the most performance:
| Threads | Sender nodes | Receiver nodes | Send msgs/s | Receive msgs/s | Processing latency | Send latency |
|---|---|---|---|---|---|---|
| 25 | 1 | 2 | 4 889 | 4 846 | 47 | 47 |
| 25 | 1 | 1 | 8 057 | 8 057 | 48 | 48 |
| 25 | 2 | 4 | 14 453 | 14 454 | 48 | 48 |
| 25 | 2 | 4 | 14 638 | 14 637 | 48 | 48 |
| 5 | 8 | 8 | 14 730 | 14 738 | 47 | 47 |
| 25 | 8 | 8 | 15 369 | 15 369 | 141 | 137 |
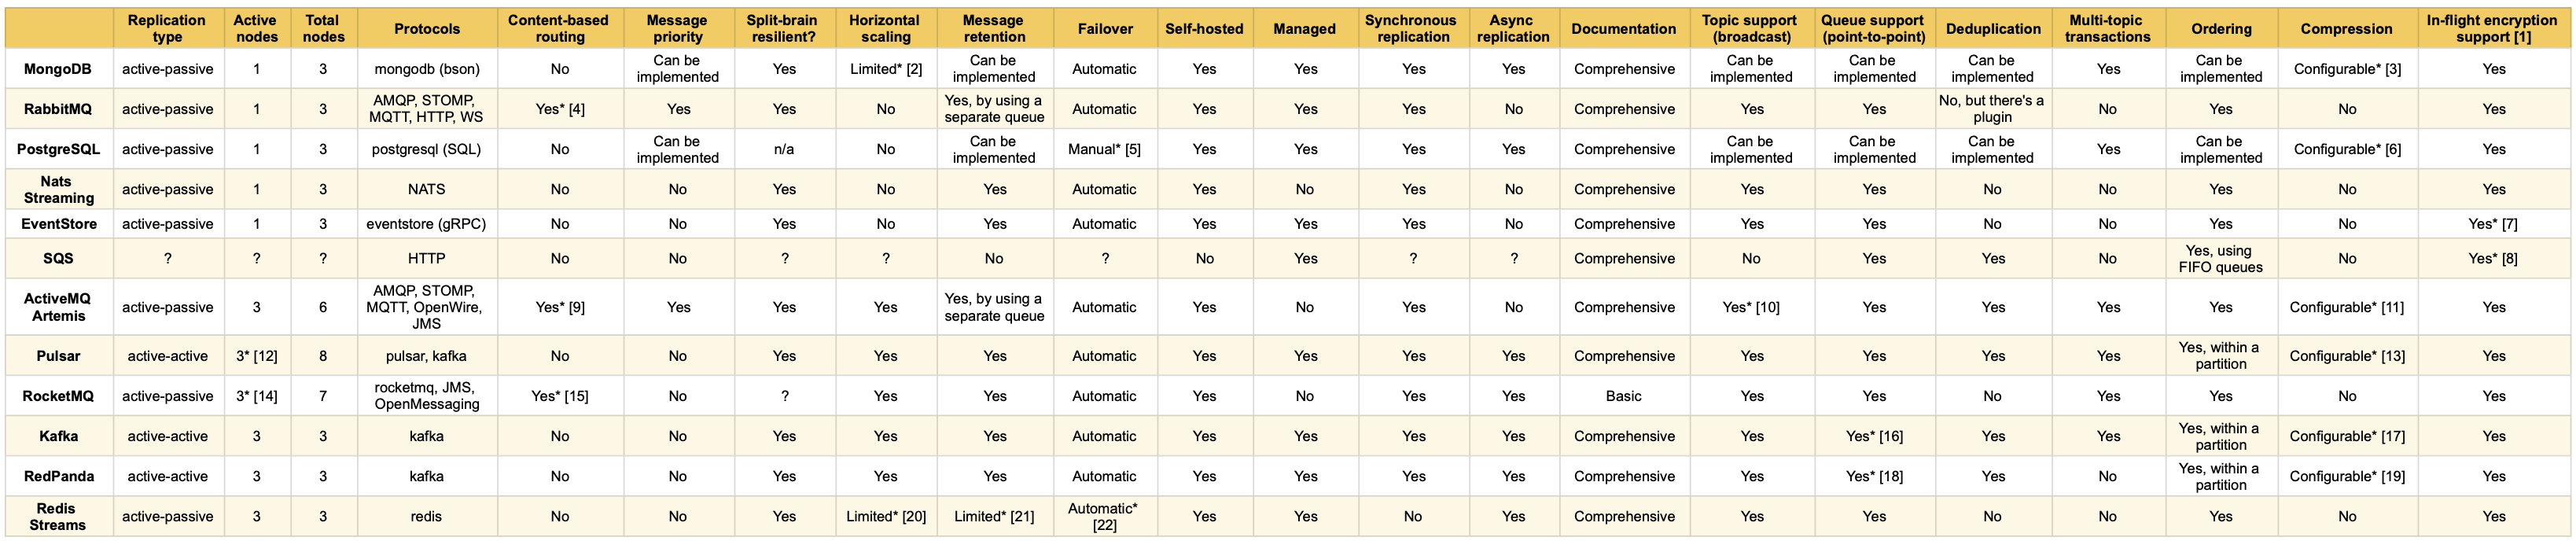
Summary of features
Below you can find a summary of some of the characteristics of the queues that we’ve tested. Of course this list isn’t comprehensive, rather it touches on areas that we’ve mentioned above, and which are important when considering replication, message persistence and data safety. However, each system has a number of unique features, which are out of scope here.
Which queue to choose?
It depends! Unfortunately, there are no easy answers to such a question :).
As always, which message queue to choose depends on specific project requirements. All of the above solutions have some good sides:
- SQS is an as-a-service offering, so especially if you are using the AWS cloud, it's an easy choice: good performance and no setup required. It's cheap for low to moderate workloads, but might get expensive with high load
- if you are already using Mongo, PostgreSQL or EventStore, you can either use it as a message queue or easily build a message queue on top of the database, without the need to create and maintain a separate messaging cluster
- if you want to have high persistence guarantees, RabbitMQ ensures replication across the cluster and on disk on message send. It's a very popular choice used in many projects, with full AMQP implementation and support for many messaging topologies
- ActiveMQ Artemis is a popular, battle-tested and widely used messaging broker with wide protocol support and good performance
- NATS Streaming support many useful communication patterns, and is especially popular in IoT deployments
- Redis Streams offers good performance on top of a popular and familiar key-value store
- RocketMQ offers a JMS-compatible interface, with great performance
- Pulsar builds provides a wide feature set, with many messaging schemes available. It’s gaining popularity, due to it’s flexible nature, accommodating for a wide range of use-cases, and great performance
- Kafka offers the best performance and scalability, at the cost of feature set. It is the de-facto standard for processing event streams across enterprises.
- RedPanda exposes a Kafka-compatible interface, focusing on zero data loss, and providing additional data processing and observability features
Still not sure which message queue is the best fit for your problem? Let us help you in choosing a particular technology, entire tech stack or architecture, given your unique requirements and constraints. Head over to our consulting services offer or contact us right away!
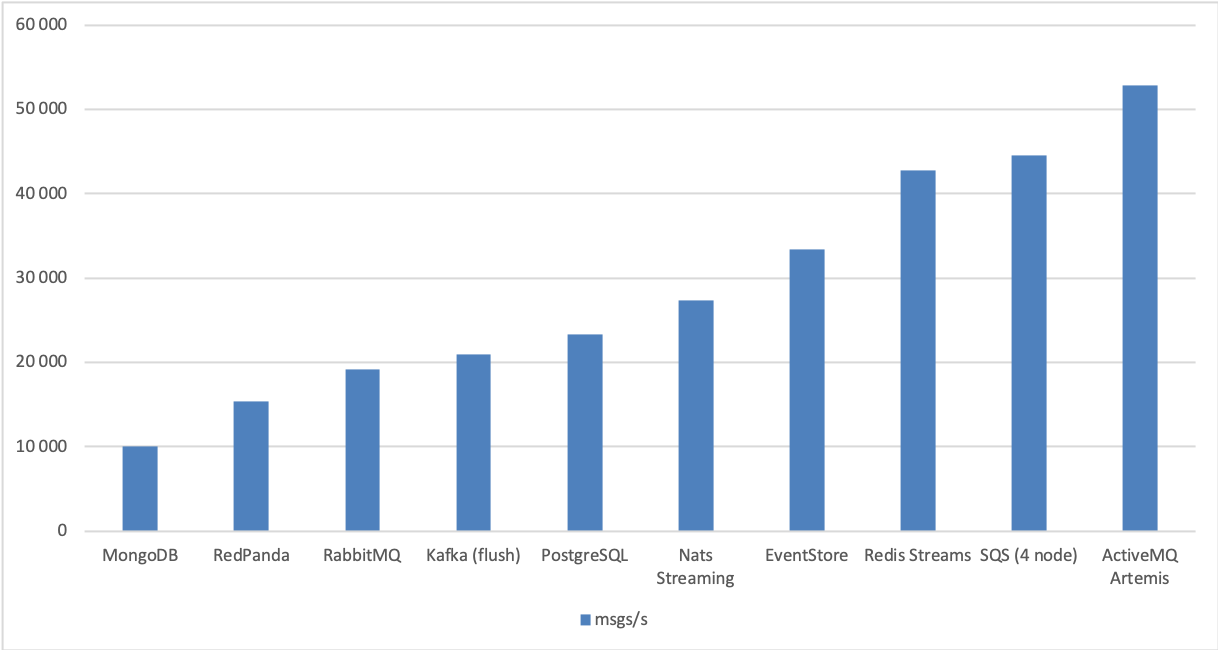
Here’s a summary of the performance tests. First, zooming in on our database-based queues, Rabbit, NATS Streaming, Redis Streams, Artemis, RedPanda and Kafka in the flush variant, with SQS for comparison:
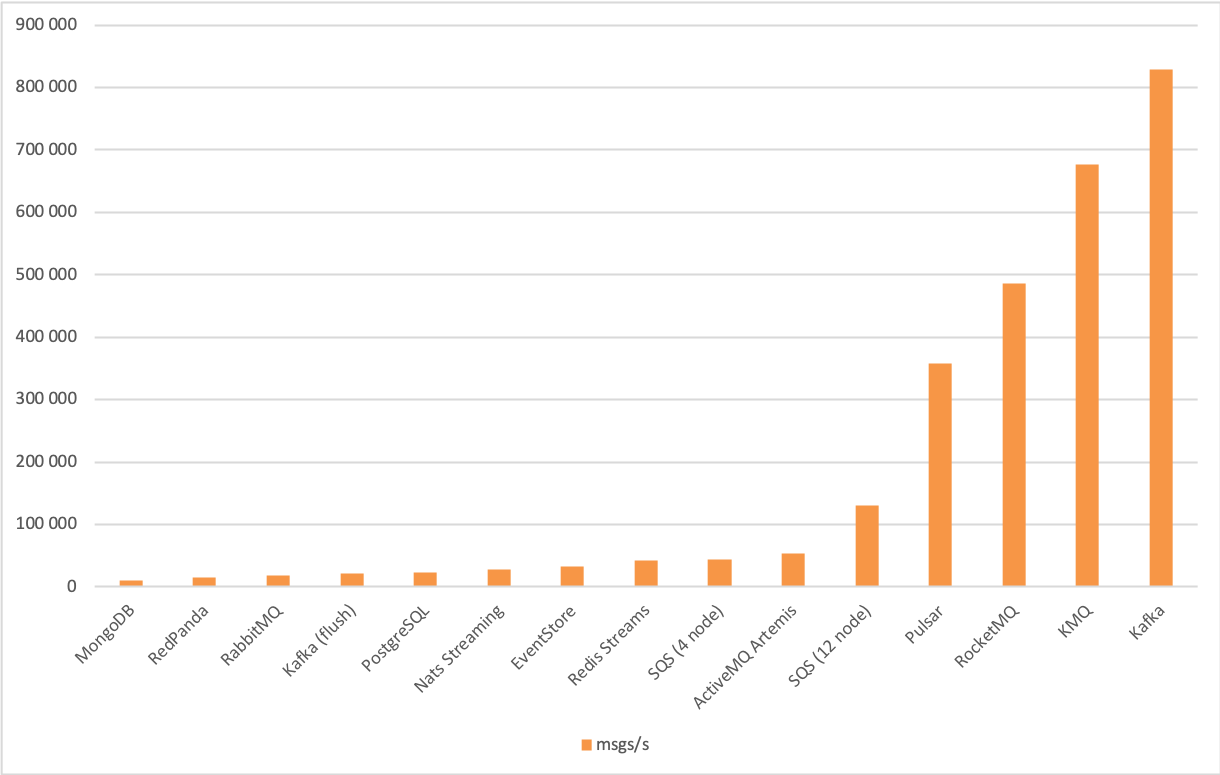
And including all of the tested queues:
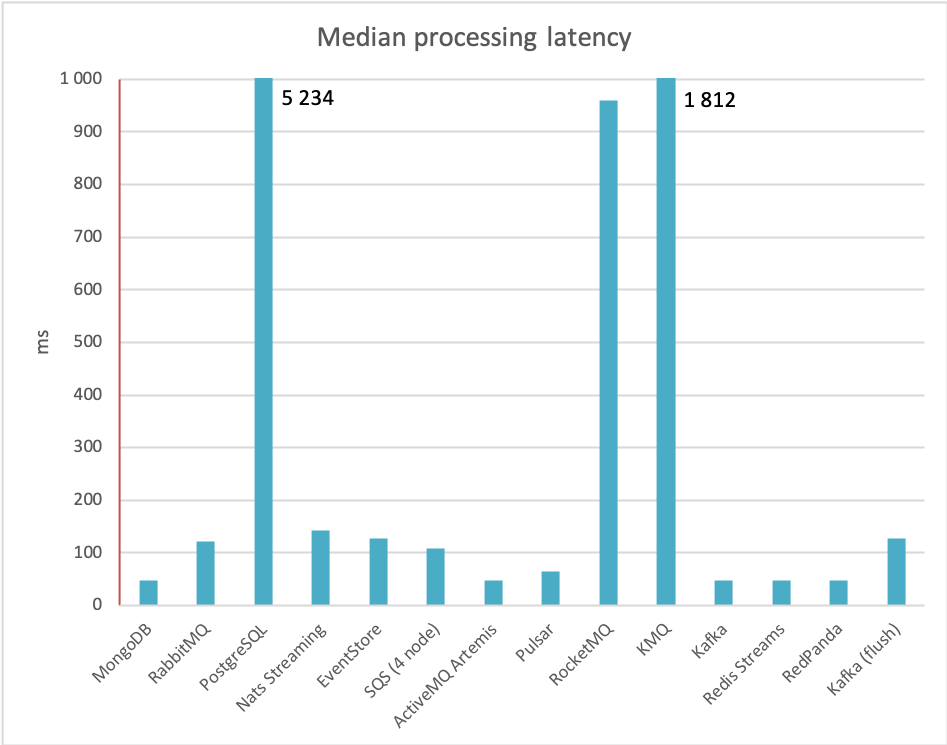
Finally, the processing latency has a wider distribution across the brokers. Usually, it's below 150ms - with RocketMQ, PostgreSQL and KMQ faring worse under high load:
There are of course many other aspects besides performance, which should be taken into account when choosing a message queue, such as administration overhead, network partition tolerance, feature set regarding routing, documentation quality, maturity etc. While there's no message-queueing silver bullet, hopefully this summary will be useful when choosing the best system for your project!
Credits
The following team members contributed to this work: Grzegorz Kocur, Maciej Opała, Marcin Kubala, Krzysztof Ciesielski, Kasper Kondzielski, Tomasz Król, Adam Warski. Clebert Suconic, Michael André Pearce, Greg Young and Francesco Nigro helped out with some configuration aspects of Artemis and EventStore. Thanks!
